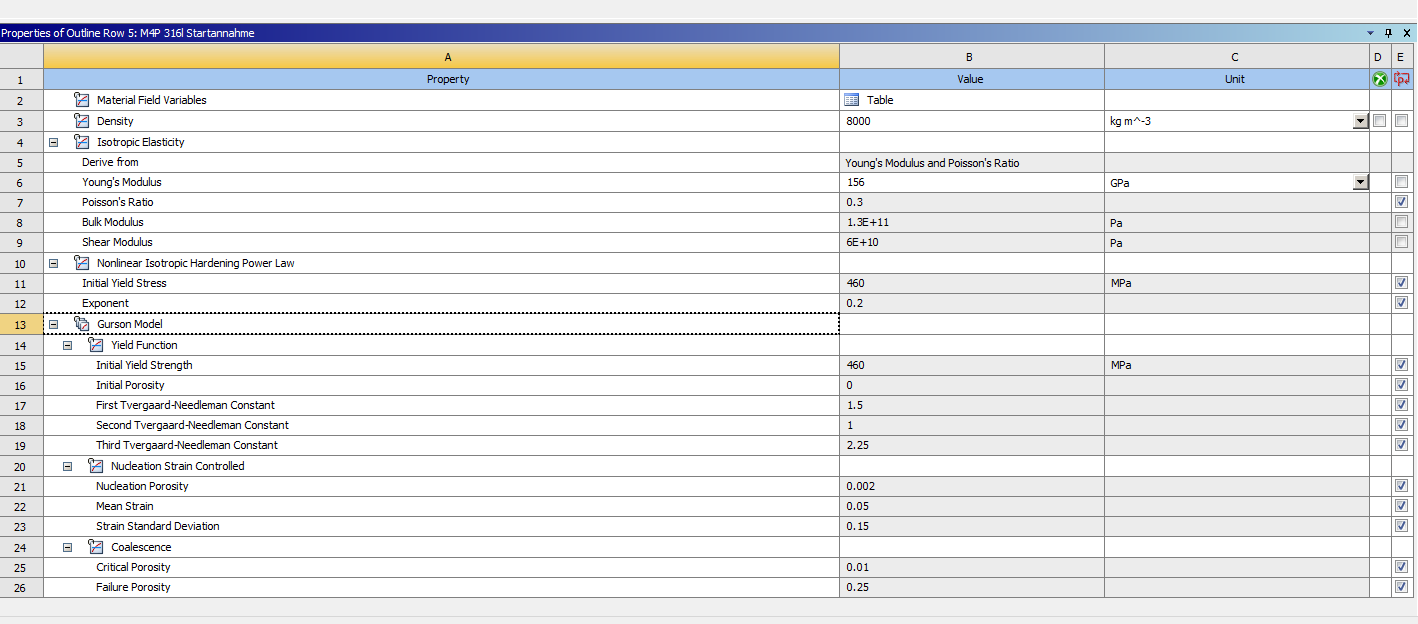
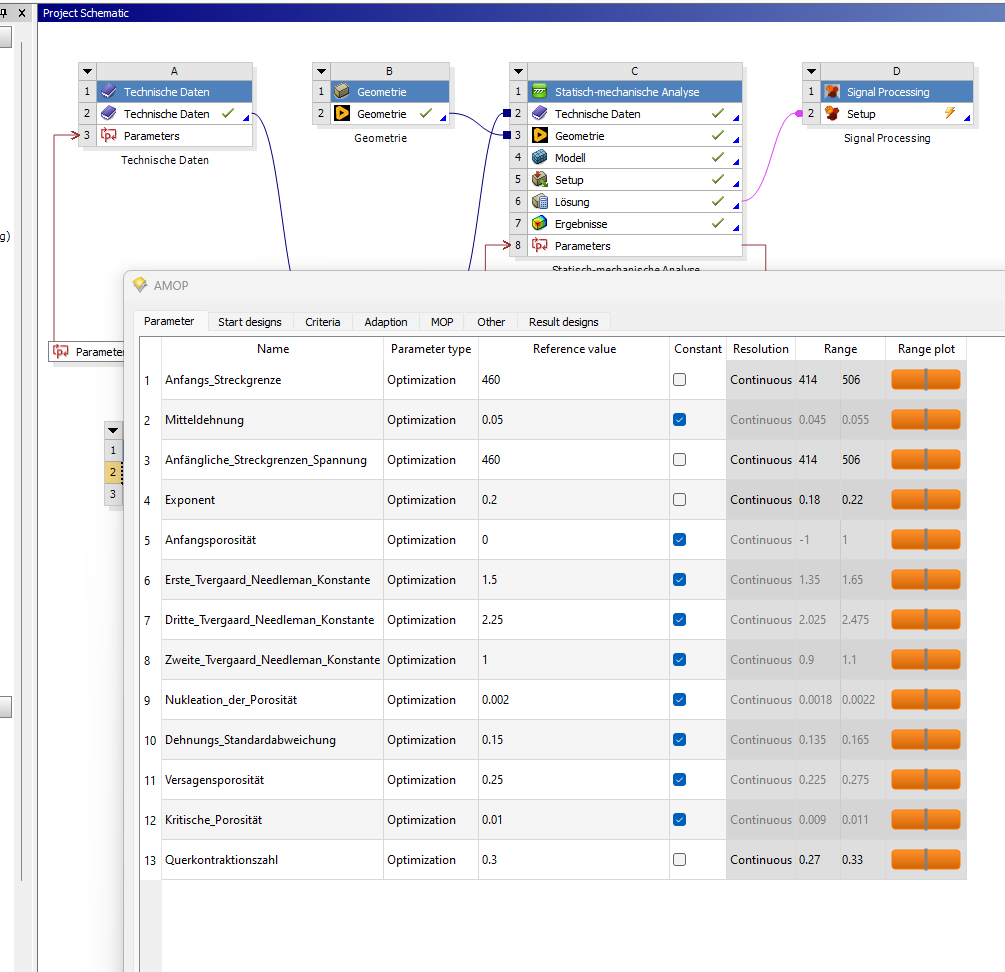
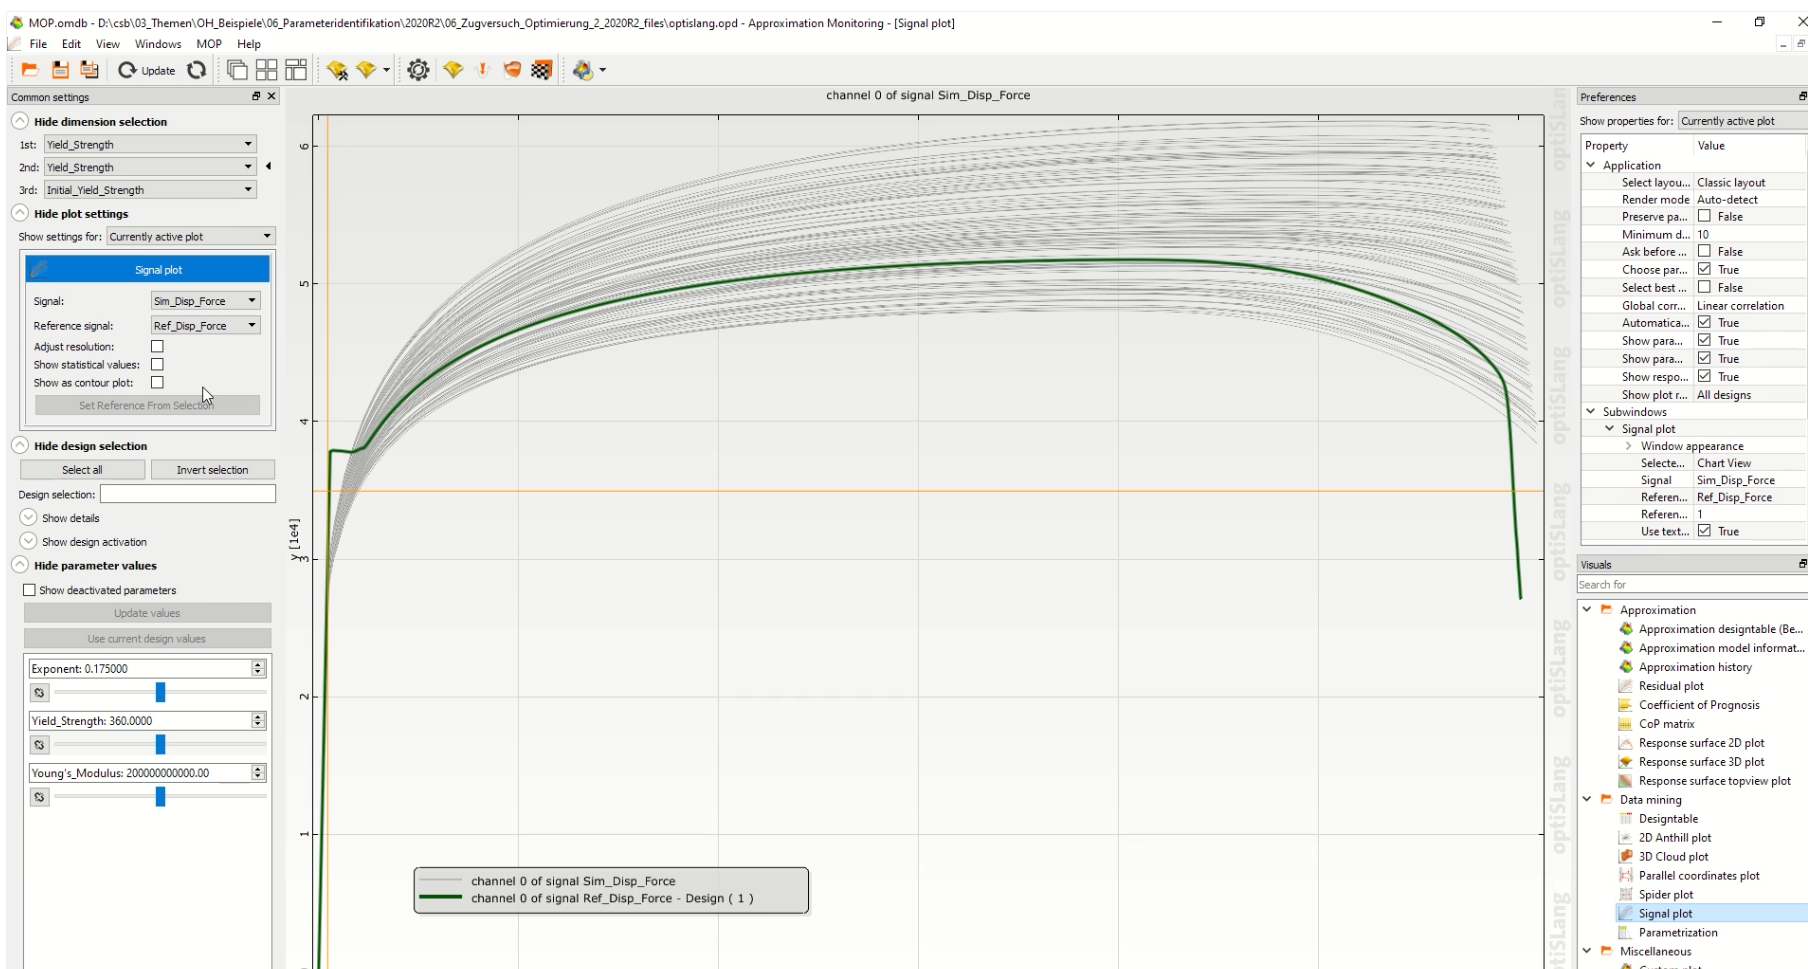
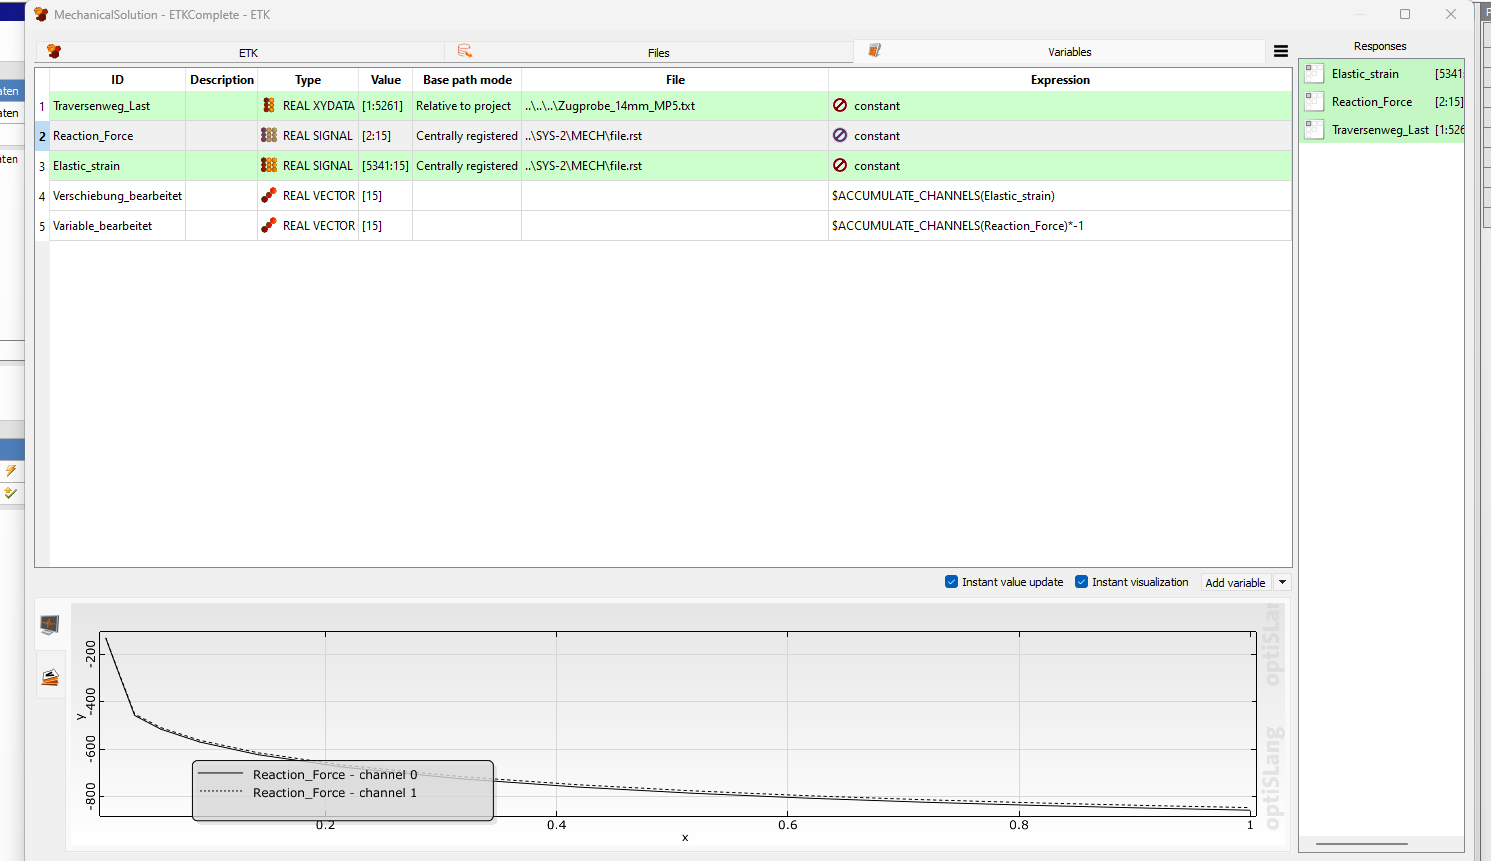
Model Calibration a material curve from tensile testa


Viewing 4 reply threads
- The topic ‘Model Calibration a material curve from tensile testa’ is closed to new replies.


