-
-
December 12, 2023 at 5:22 pm
javat33489
Subscriber -
December 13, 2023 at 12:09 pm
V.P
Ansys EmployeeHi Javat,
You can turn off Auto-Range in contour settings. This will automatically enable 'clip to range' option. Specify a minimum value of 0 Pa and a maximum value of 58823.24 Pa or 36882.77 Pa. This will clip away the contour for pressure values above the max-specified value. So you can now see the low pressure zones alone in the contour.
-
December 15, 2023 at 6:29 pm
-
December 25, 2023 at 6:07 pm
javat33489
SubscriberI need help. What other ways are there to see these low pressures? I think it's in the boundary layer. Is it possible to set the MAX and MIN markers as in the static analysis of a workbench?
-
-
December 26, 2023 at 8:40 am
V.P
Ansys EmployeeHi Javat,
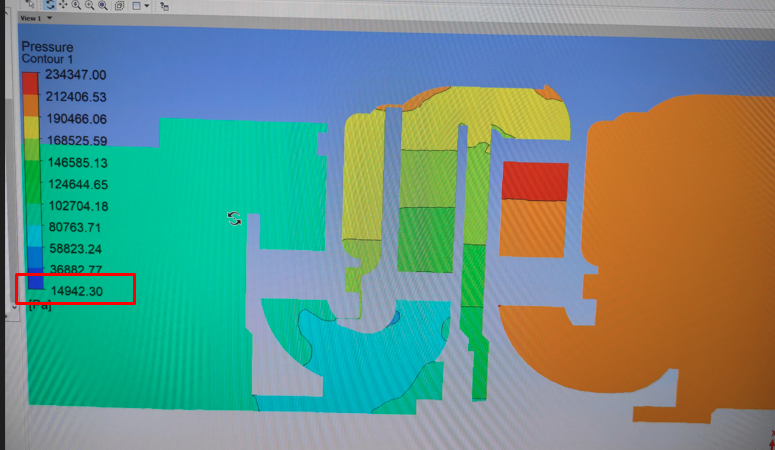
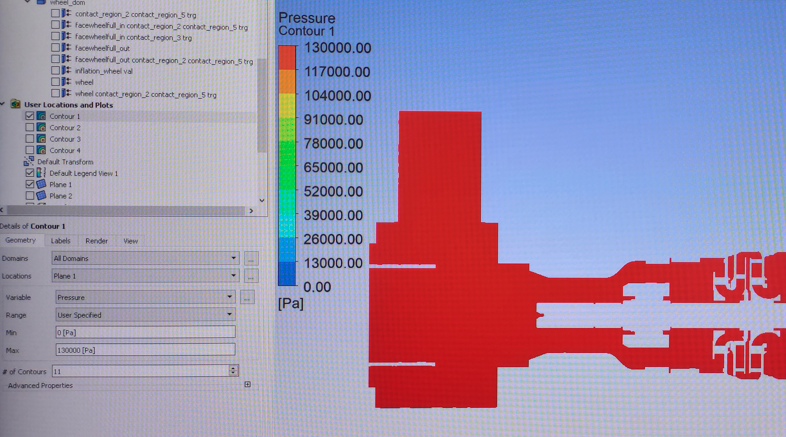
I can see that you are using CFD-Post to post-process the results. In the CFD post, you can set Min Max values, and I think you have specified it correctly from the screenshot. In addition, if you expand the advanced properties section, you can see an option to clip to the range.Â
You can also choose the variable location and I suggest you change it to the face option, which will show the cell center values in the contour, so you see which cells have low-pressure values.
-
December 26, 2023 at 4:34 pm
javat33489
SubscriberThanks for the answer. Trimming the range doesn't help. Because everything is painted at high pressure according to the range and low pressure is not visible.Is it possible to put MAX and MIN pointers like in the workbench like this:To indicate the minimum pressure points.ÂI think that this pressure is somewhere in the boundary layer, it is very thin and cannot be seen.-
January 8, 2024 at 8:52 am
NickFL
SubscriberAnd just another thought here, if you wanted the equivalent of probes, you could create a Point. Change the method from XYZ to variable minimum (or maximum) over the domain.
-
-
December 28, 2023 at 6:38 pm
javat33489
SubscriberHELP PLEASE
-
January 11, 2024 at 1:33 pm
NickFL
SubscriberAre you still looking for a solution, or have you accomplished what you wanted?
-
-
-
January 7, 2024 at 10:42 am
javat33489
SubscriberHappy new year friends. I still need help. how to display a low pressure zone that is not visually visible? I think it's somewhere in the boundary layer, but I need to understand if it's really there?
-
January 8, 2024 at 8:47 am
NickFL
SubscriberIt looks like you have results only on a plane and it is possible that you have the contour limits as global max and min. This means that the low pressure could be other places than your plane. Try creating an Isovolume at a level a bit larger than this minimum value. This will show you where it is in the 3D space and with the wireframe of the geometry you should be able to determine where it is. You could also probe this volume to find X,Y,Z values that would allow you to put cutplanes thru this low pressure region.
Â
To create Isovolume:
- Right-click User Locations -> Insert -> Volume
- Give it a name
- Change the definition method to Isovolume and Variable to Pressure
- Five the level at which you want the volume.
-
-
- The topic ‘Low pressure zone in fluent’ is closed to new replies.
-
3597
-
1283
-
1117
-
1068
-
983
© 2025 Copyright ANSYS, Inc. All rights reserved.