Loading same .xy files to XY Plot but plotting a different curve in Fluent?
TAGGED: fluent, postprocessing, xyplot
-
-
April 23, 2024 at 2:22 pm
Dato
SubscriberHi everyone,
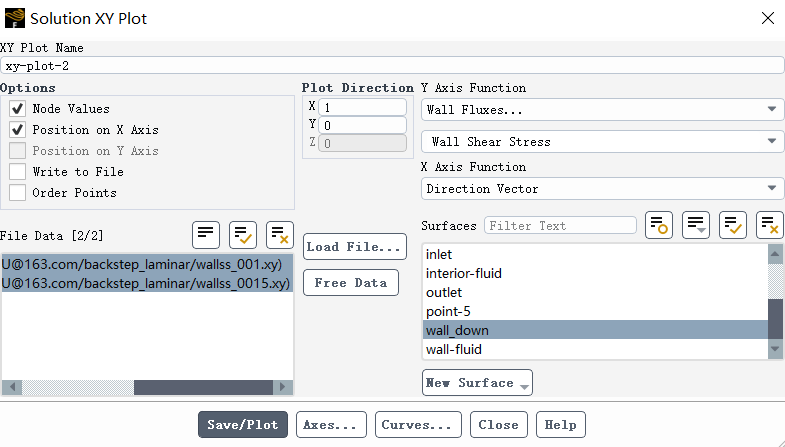
I want to compare the difference of wall shear stress under different Renolds at same wall location. I have three cases. I have written two results to .xy files of different cases and loaded them in XY Plot panel in the third case.
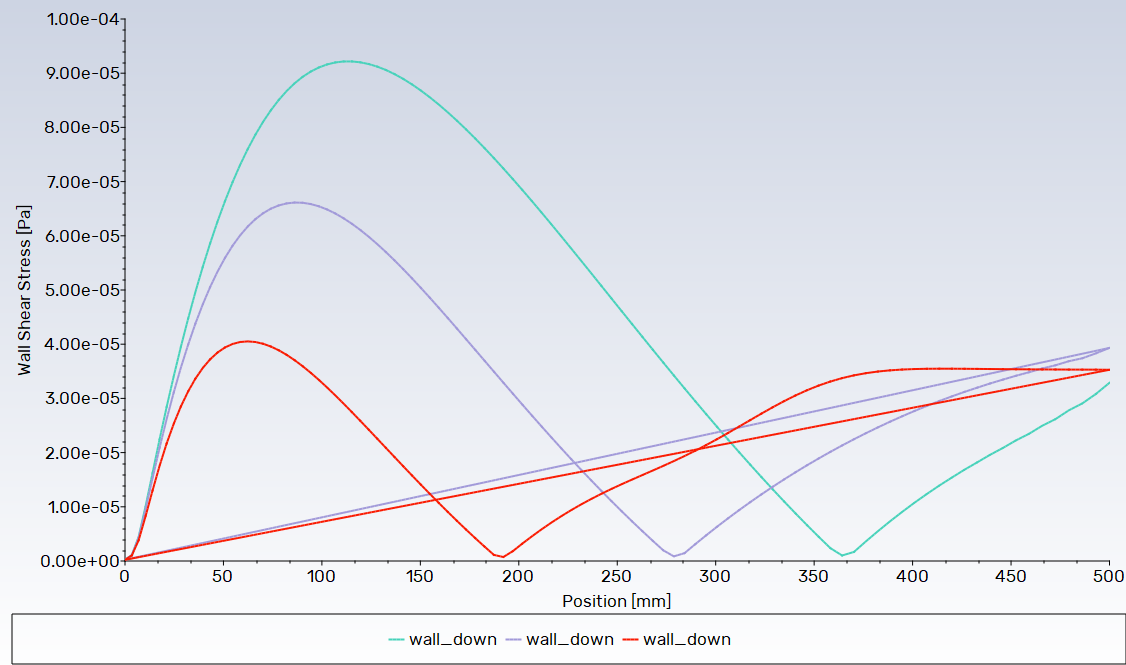
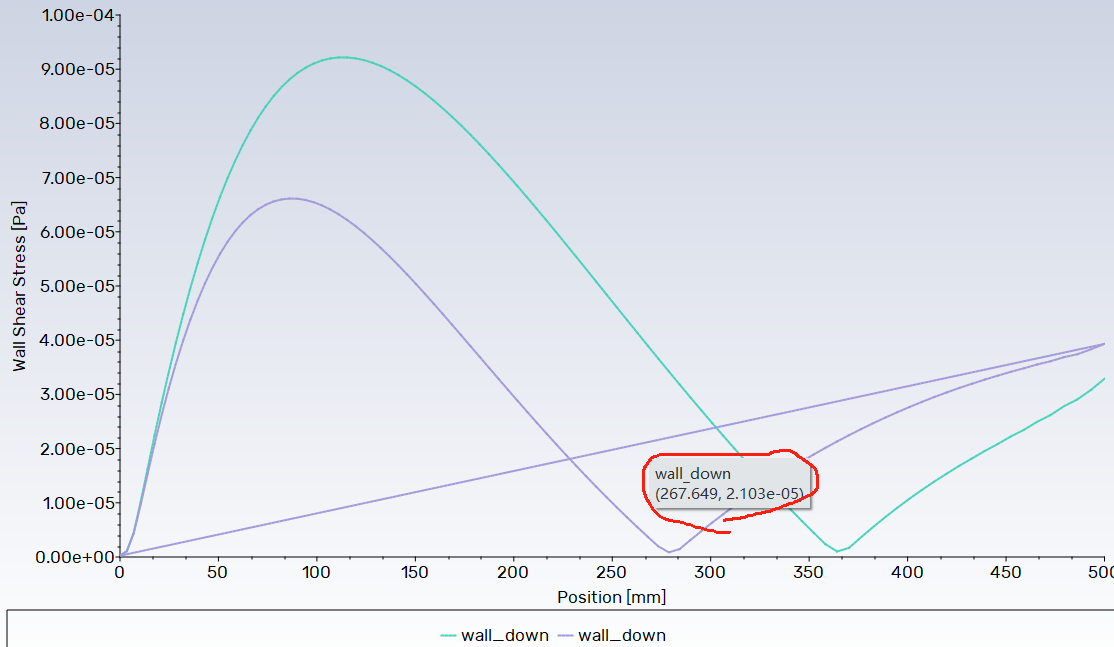
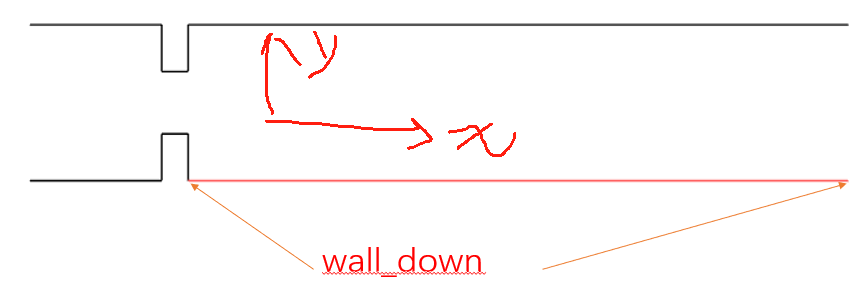
The wall_down is a line surface. It's so puzzled that loaded xy files was plotted automatically closed but the wall shear stress of current case is acting normally. I have try plot them separately in their case and Fluent can plot normally. But if I load them into another case, they becomes closed curves. It's stranger that I have checked data in .xy file and there are no data on the straight line closed by Fluent, but when I hover mouse on the line it shows data on the line.
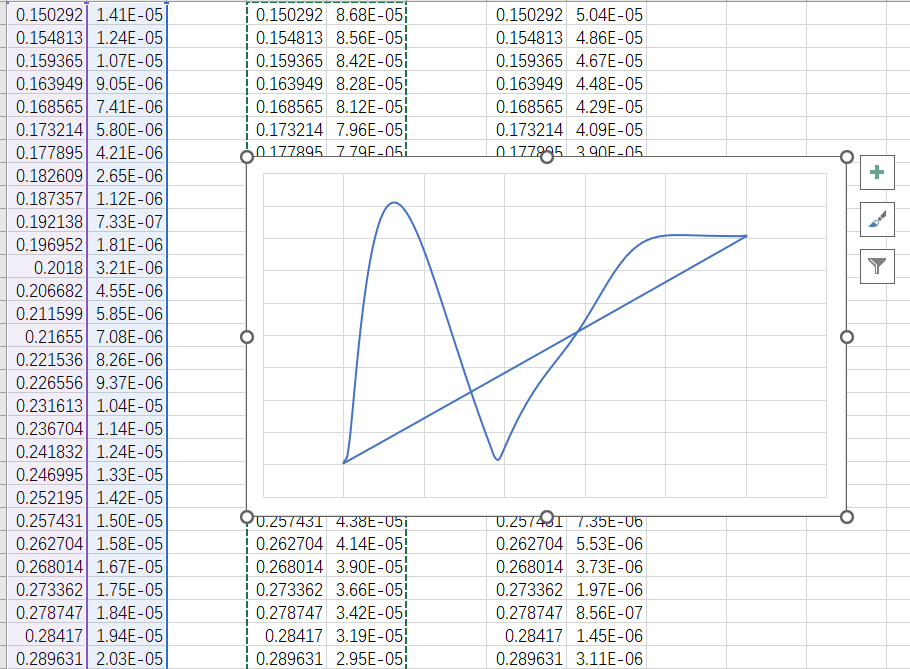
And I try to plot using curve in Excel and it appears like Fluent. It seems that Fluent is performing better than Excel ?
It's quite confused and it's my first time to encounter this issue. It's quite inconvenient for me if I cannot plot curves of different cases. Is it a bug?
Any explanation and suggestions is asspreciated.
Regard.
-
April 24, 2024 at 1:10 pm
Rob
Forum ModeratorCheck the first and last data points in the file(s) as it's possible the export did something odd. Historically we plotted all of the curves in Fluent as Excel wasn't available or didn't work too well: Fluent has been around longer than Excel....
-
April 24, 2024 at 2:23 pm
Dato
SubscriberHi Rob,
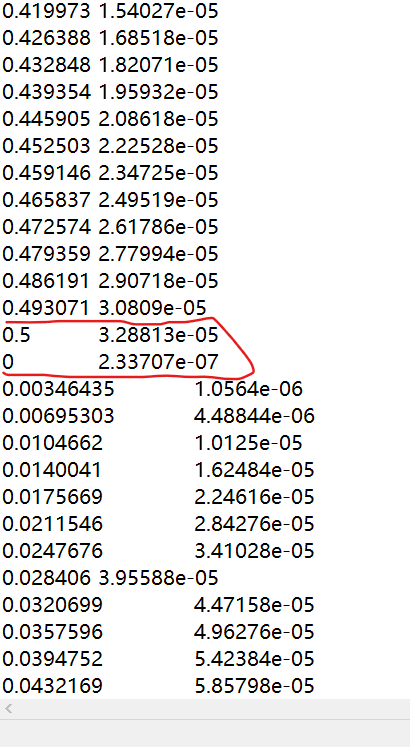
I figured it out but there's still existing problems. I found out that data of x function in exported .xy file aren't arranged in order. Data is separated into two group arranging in ascending order. As you can see below.
I guess the algorithm of Fluent to plot xy plot is that it reads data and plots curve at the same time. When it have read data of 0.5, it would read data of 0 next. Accordingly, the curves was closed. I copied data into Excel and arranged them in ascending order. Then I pasted them back to .xy file and reloaded into flunent. It works.
I'm still confued. Is it a bug? It seems that we cannot load origin .xy files into Fluent to plot simply. And this problem is seldom mentioned. Would Fluent repair the matter in future version?
Again thanks you Expert.
-
-
April 24, 2024 at 2:58 pm
Rob
Forum ModeratorAre you plotting coordinate position or length from start of line? Also, what shape is the line in the model? Pictures may help.
-
April 25, 2024 at 12:52 am
-
-
April 25, 2024 at 10:51 am
Rob
Forum ModeratorIf you replot with x coordinate as opposed to curve length how does it look?
-
April 26, 2024 at 1:03 am
Dato
SubscriberIt's x coordinate that I plot.
-
-
April 26, 2024 at 1:02 pm
-
April 26, 2024 at 2:42 pm
Dato
SubscriberOh, it's another questions I have been confused. I don't know why the "order points" button is grey and cannot be selected all the time. In what kind of condition can you select the button?
-
April 26, 2024 at 2:54 pm
Rob
Forum ModeratorIt looks like it's linked to Write to File, https://ansyshelp.ansys.com/account/Secured?returnurl=/Views/Secured/corp/v222/en/flu_ug/flu_ug_plots_task_page.html%23flu_ug_Solution_XY_Plot Whether the option should grey out again when that's deselect is another matter: I'm using an old Fluent build at present.
-
April 28, 2024 at 2:46 am
Dato
SubscriberThank you so much sir. I ignored this button that I haven't consider before and it seccessfully solved the problem. You are quite experienced to solve a specific problem.
-
-
- The topic ‘Loading same .xy files to XY Plot but plotting a different curve in Fluent?’ is closed to new replies.


-
5159
-
1836
-
1387
-
1249
-
1021

© 2026 Copyright ANSYS, Inc. All rights reserved.

