-
-
December 25, 2021 at 3:00 am
Balc
SubscriberHello.
I am doing a static simulation in static structural and I have performed a linear simulation(using linear material) and then performed a non linear simulation( using a non linear material).
After a convergence study, I selected a suitable mesh of 3 mm.
I have used the aluminum alloy delivered by the ansys material library, which has a Sy=280 MPa (yield stress). For the linear simulation, I obtained a stress result of 630 MPa, and for the nonlinear simulation I obtained a stress of 310 MPa.
However, I then changed the material to a titanium alloy which has a Sy=930 MPa (yield stress). And for the linear analysis I got 620MPa and for the nonlinear simulation I also got 620 MPa with negligible difference.
Then, I changed to a structural steel material which has a Sy=250 MPa. In the linear simulation I got 621 MPa and in the nonlinear simulation I got a stress of 274 MPa.
All the stresses I mentioned that were obtained correspond to the equivalent Von Mises stress.
Who can explain me this phenomenon, I am confused with the results. Which results should I consider correctly? Is it related to the strength capacity of the material? That is, if the material supports the applied loads?
Thank you.
December 25, 2021 at 1:36 pmRameez_ul_Haq
Subscriber,what is the point of entering the material non-linearity if you know that the stresses are going to be lower than the yield strength of the material? We use material non-linearity when we want to observe the behavior and results of the structure, especially at the region which is manifesting higher stresses than the yield strength (since this asserts that this region is the place where the permanent plastic deformation will be very dominant).
Now, for the titanium alloy, the yield strength is already 930 MPa, which is quite higher than the stress of 620 MPa. This means that the point where you are seeing a stress of 620 MPa won't deform plastically (and its stress will not decrease after inserting a material non-linearity) at all, since the stress is already lower than the yield strength.
And also, if you want to know that why does the stress (which appears to be greater than the yield strength of that material) decreases when using material non-linearity, then the reason is that the plasticity results in loss of stiffness of the structure. This means that the stress needs to get relieved at that location, since the structure is no longer capable of bearing so high stresses.
If this helped, don't forget to accept the answer.
December 25, 2021 at 4:52 pmpeteroznewman
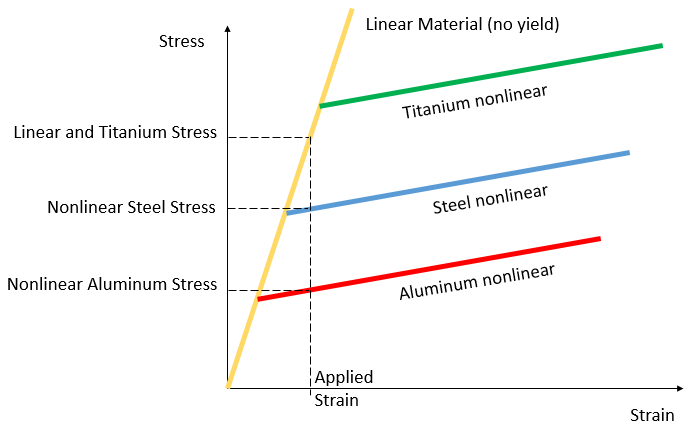
SubscriberThe following figure illustrates (not to scale) some relevant features of the cases you simulated.
 The yellow line is the linear material stress-strain curve and the elastic portion of the nonlinear material stress-strain curve. With linear materials, as the strain increases, the stress just keeps going up and up the yellow line without limit.
The red, green and blue lines are the plastic potions of the nonlinear stress-strain curves. They each start at the Yield point.
With nonlinear materials, as the strain increases, the stress goes up the elastic portion until the yield point, then follows the flatter plastic portion.
For the load you applied, when the material was Titanium, the stress did not reach the yield point, so the stress for that and the linear materials were in the 620-630 MPa range.
When the material was nonlinear steel or aluminum, the stress is slightly above the yield strength of each material.
Viewing 2 reply threads- The topic ‘Linear vs. nonlinear analysis’ is closed to new replies.
Innovation SpaceTrending discussionsTop Contributors-
4678
-
1565
-
1386
-
1241
-
1021
Top Rated Tags© 2025 Copyright ANSYS, Inc. All rights reserved.
Ansys does not support the usage of unauthorized Ansys software. Please visit www.ansys.com to obtain an official distribution.
-


Ansys Assistant

Welcome to Ansys Assistant!
An AI-based virtual assistant for active Ansys Academic Customers. Please login using your university issued email address.
Hey there, you are quite inquisitive! You have hit your hourly question limit. Please retry after '10' minutes. For questions, please reach out to ansyslearn@ansys.com.
RETRY


