TAGGED: stl-import
-
-
July 21, 2023 at 3:30 pm
Miller Testing
SubscriberHello Admin,
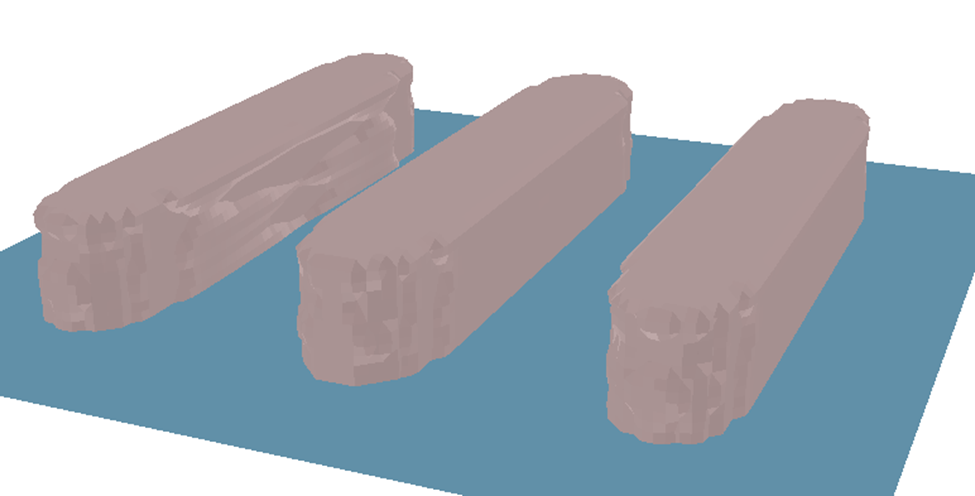
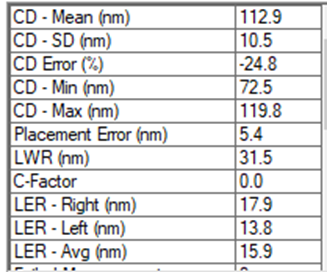
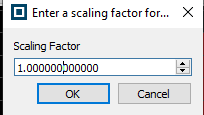
I wanted to import .stl files using the 3D resist profile from Prolith into FDTD. When I tried to import the .stl file, FDTD asked me to determine the scaling factor for the data. I wanted to keep the original size of the data in nanometers (nm), so I set the scaling factor to 1. (I have attached a picture of my simulation and the parameters of the .stl file below).
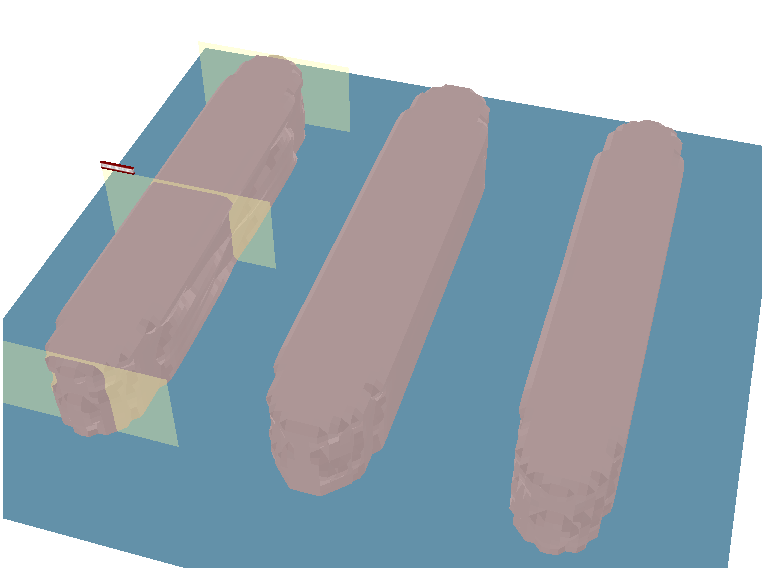
.stl file
The measurement value is from the left line block of the .stl file.
Scaling factor from FDTD
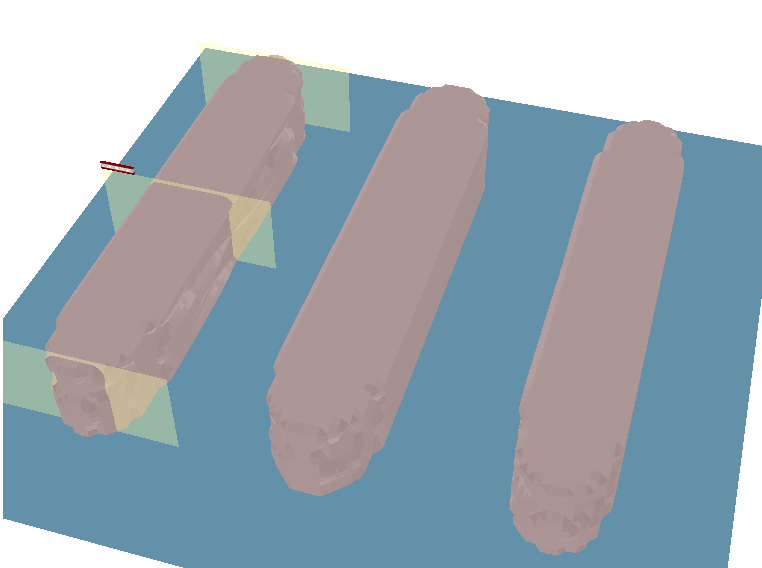
However, when FDTD successfully imported the .stl data, it seemed that the size of the data became exceedingly larger in FDTD compared to the original CD mean measurement value. I tried setting the scaling factor to 1, 0.001 (10^-3), and 0.000001 (10^-6), but the size of the block or planar solid was still large. I also tried making the grid size in FDTD similar to the grid size that I used in Prolith before importing the .stl file (grid size of 10 nm), but the result was still the same - I got a larger size value for the structure.
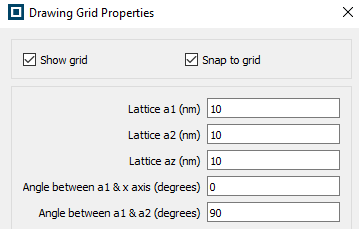
grid sizes in prolith
grid sizes in FDTD.
The measurement value width is at a scaling factor of 1. The XY view cannot show the whole picture of the .stl file because the value is too big (140000000000 nm)
The measurement value width is at a scaling factor of 0.001 (10^-3) (129000000nm)
The measurement value width is at a scaling factor of 0.000001 (10^-6). (131000nm)
But when I tried setting the scaling factor to 0.000000001 (10^-9), I saw that the width of one of the planar solids became close to its original size (CD Mean) using a ruler, as you can see from the picture below. However, I am not sure if the measured value from the ruler can be used to compare with the original .stl data because after importing, it became a planar solid and I could only modify its x, y, and z positions. It did not show any other values.
ruler tool in FDTD
The measurement value width is at a scaling factor of 0.000000001 (10^-9) (129nm)
The measurement value is from the left line block of the .stl file. (CD mean is 112.9 nm)
The left side of the beam in the .stl file
So, I have some questions:
1. Did I miss any steps or do anything wrong when trying to rescale the .stl file? Is there anything else that I need to do before importing my .stl file in order to avoid problems with its size becoming larger in FDTD than in its original file?
2. Currently, I am only measuring the width of the planar solid using a ruler in FDTD and my .stl file has a peculiar shape with different width values, as you can see from my previous image attachment. Hence, I want to ask if there is any way or tool that can help me know or measure precisely in FDTD, such as x span, y span, average width, etc., for my imported .stl file.
3. Is there any way that I can know the value of the sidewall angle of the imported structure and any values besides the left and right sidewalls? Such as line edge roughness (LER) and line width roughness (LWR), so I can make a direct comparison to see if the values for the sidewall angle, LER, and LWR are the same as in the original data in FDTD?
Thank you very much for your attention and kind support.
Regards,
Miller.
-
July 21, 2023 at 6:26 pm
Guilin Sun
Ansys EmployeeBy default FDTD assumes the origial data has meter in unit. So you may need to test the scalling factor to be 1e-9; you can use a rectangle geometry for testing.
The "ruler" is the easy tool to roughtly measure sizes. You can also do a simulation with standard geometry such as rectangle and use script to get data from index monitor. Please note that after meshing the geometry will not be exactly the same as the continuous geometry.
I do not think there is a direct way to measure the angles. You can use a standard geometry with side angles and use two monitors. After simulation you can compare the data and calculate the angle.
-
July 21, 2023 at 8:38 pm
Miller Testing
SubscriberDear Guilin Sun,
Thank you for your detailed explanation about the FDTD unit, scaling factor, and the use of the ruler and index monitor. I appreciate your suggestion to use a rectangle geometry for testing.
Could you please provide me with more information on how to use the script to get data from the index monitor? Also, could you explain more about the continuous geometry and what kind of monitors would be suitable for my case? Lastly, when you mentioned using a rectangle geometry for testing, were you referring to the rectangle shape in the structure tools?
In addition, could you please recommend a suitable standard geometry with side angles for me to simulate and elaborate on how to use two monitors to calculate the angle after simulation?
Thank you for your help.
Best regards,
Miller.
-
July 27, 2023 at 3:43 pm
Miller Testing
SubscriberI
-
-
July 21, 2023 at 10:35 pm
Guilin Sun
Ansys EmployeePlease refer to the script articles for more details: https://optics.ansys.com/hc/en-us/articles/360037228834-Lumerical-scripting-language-By-category
you can use for example getdata, getresult to get the refractive index;
The monitors are mostly for simulation results. Only index monitor can give you geometry profile information from refractive index.
Using rectangle to test is because you know the edge length for each side.
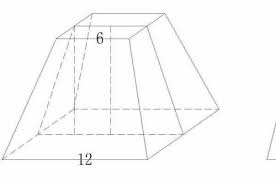
for side angles, you can built a trapezoid like this
you have a monitor close to the top and another monitor close to the bottom. You know the height (monitor location difference) and the lateral sizes from the monitors you can roguthly calculate the title angles. Right? of course you can have your own ways to verify this. But usually it is not necessary.
-
July 28, 2023 at 7:14 am
Miller Testing
SubscriberHello Admin,
Thank you for providing me with more information and for directing me to the script articles. I appreciate your suggestions on using the getdata and getresult functions to obtain the refractive index, as well as your explanation on how to use the monitors and rectangle geometry to test and verify my simulation results.
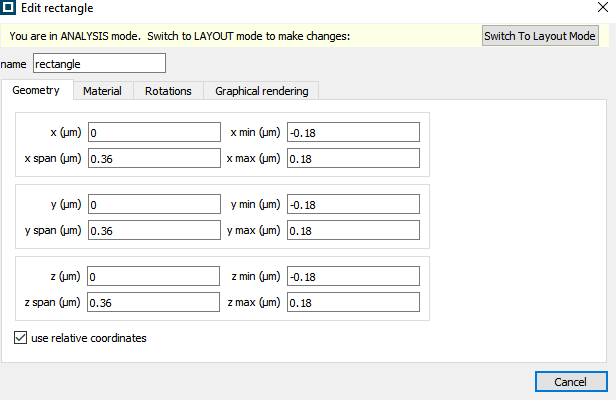
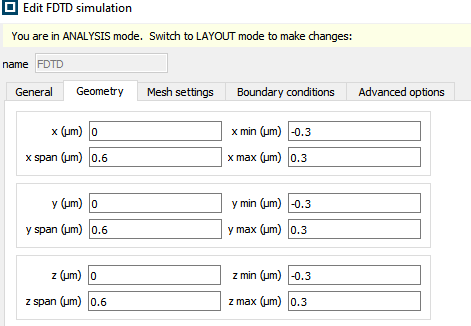
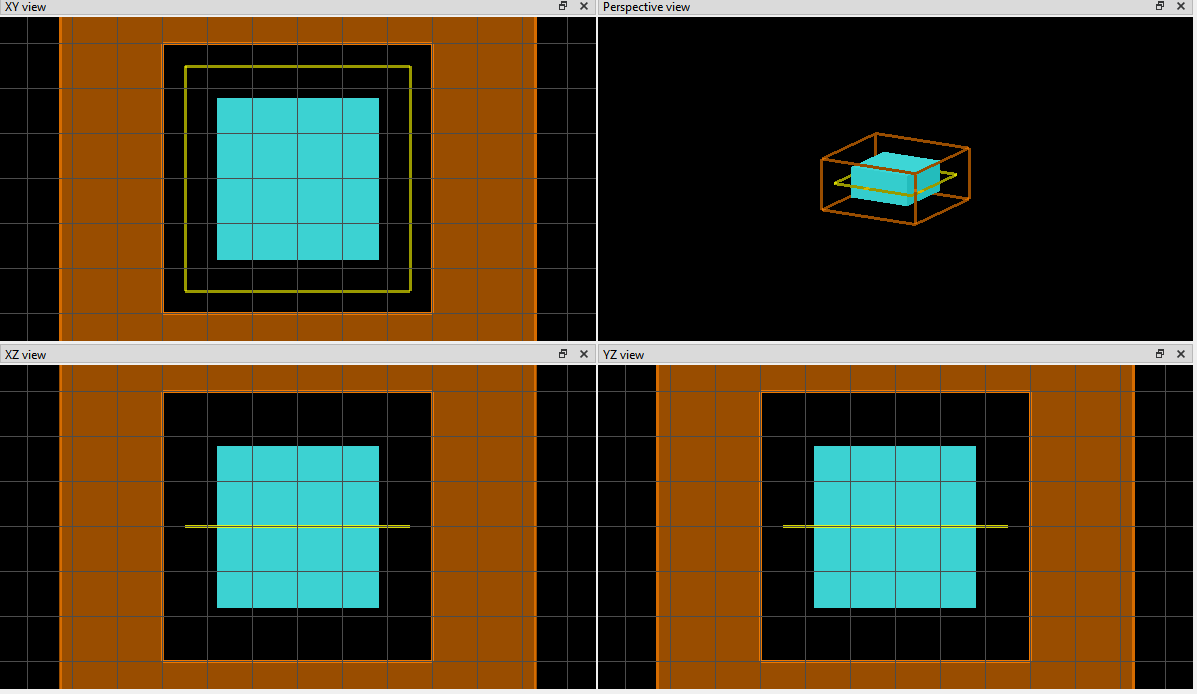
I attempted to conduct a simulation using standard geometry, such as a rectangle with an x, y, and z span of 0.36um. As a result, the minimum and maximum positions of the span were -0.18 to 0.18um, as shown in the picture below.
In the model, I utilized a simulation region, a rectangle structure, and an index monitor. The x and y spans of my index monitor were 0.5um respectively, and I used a monitor type of 2D Z-normal. The x, y, and z spans of my simulation region were 0.6um respectively.
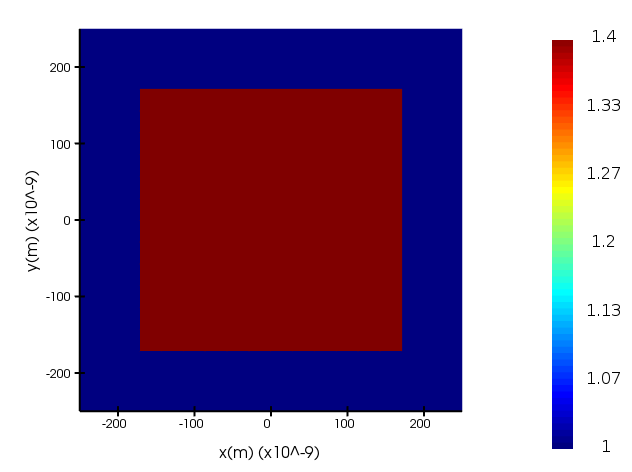
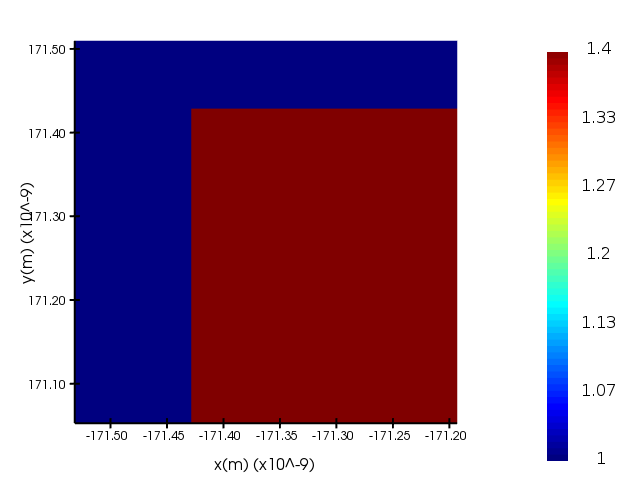
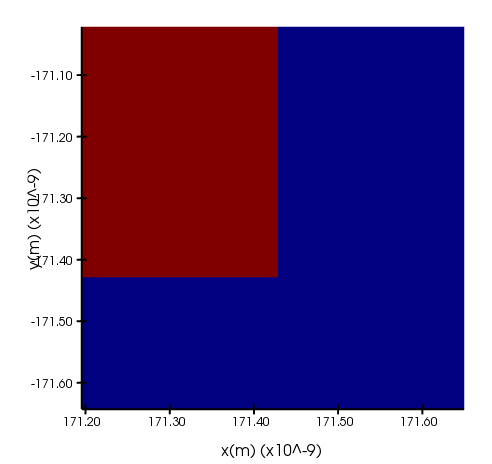
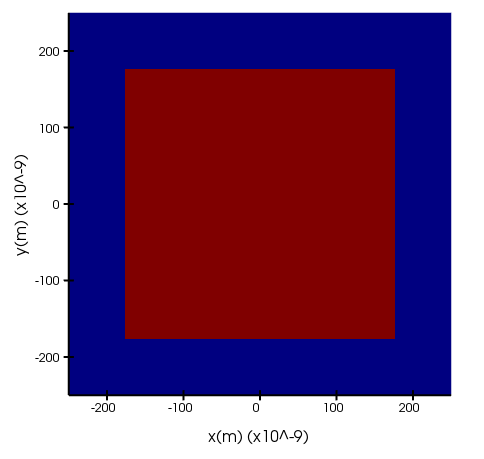
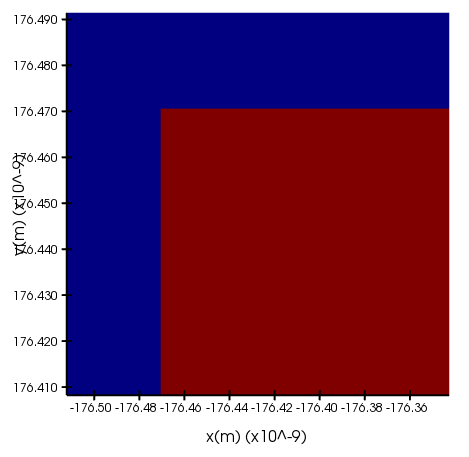
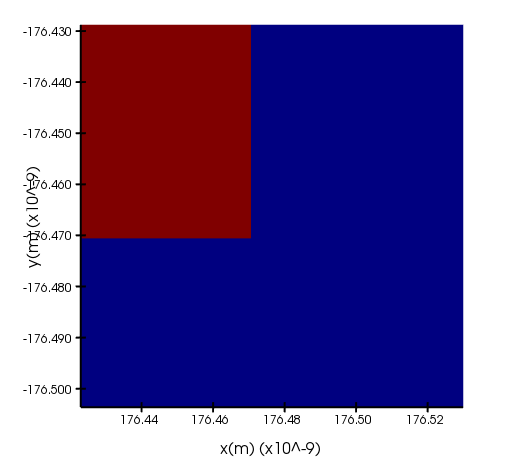
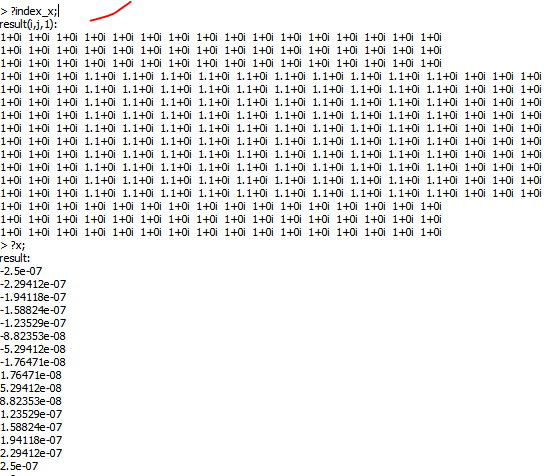
Before or after running the simulation, the size of the rectangle decreased to around 0.171um. I expected it to become 0.18um for the x and y axes.
I attempted to run the simulation using the following script:
# Get data from the index monitor
x = getdata(“index”,”x”);
y = getdata(“index”,”y”);
z = getdata(“index”,”z”);
index_data = getresult(“index”,”index”);
?size(index_data.index_x);
index_x = pinch(index_data.index_x,4,1);
# Plot the index data as an image
image(index_data.x*1e6,index_data.y*1e6,index_x,”x (um)”,”y (um)”,”index”);
However, I still obtained the same result.
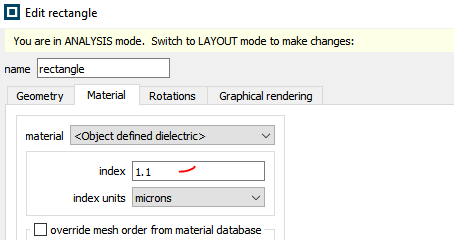
When I changed the refractive index material of the structure from 1.4 (which resulted in a size of 0.171um) to 1.1, the size of x and y in the index monitor increased to 0.176470um. However, this is still not close enough to the original size of 0.18um for the rectangle.
This is the layout of my simulation model.
I have several questions:
1. Is there anything wrong with my model or anything that I did incorrectly during the process that resulted in different sizes in the index monitor?
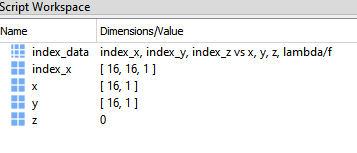
2. When I attempted to run the script, I obtained the following data in the script workspace:
Previously, you mentioned using a script to obtain data from the index monitor. Is “index_x” the data that I need to retrieve in order to measure the geometry? I am still somewhat confused about the output of this data (it also has the same output data for “index_y”). Could you please assist me in understanding whether this is the correct data that I should be obtaining and how I can measure or convert this data into a geometric value or parameter?
3. Regarding your previous statement that “after meshing, the geometry will not be exactly the same as the continuous geometry,” is this one of the effects or results that occurred in my simulation where the size of the geometry became different from its original size? If so, are there any methods or tools that I can use to preserve and measure the original geometry of the structure after meshing?
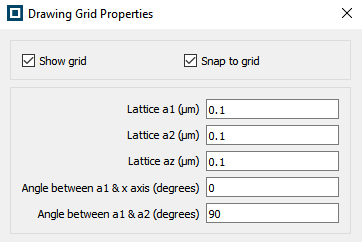
4. I am currently using the default grid size of 0.1um or 100nm. However, when I tried changing the grid size to 1nm, 5nm, and 10nm and imported my structure.stl files, I still obtained the same geometry results. I am wondering if changing the grid size will have any effect on the geometry sizes for both the rectangle and the index monitor?
I would greatly appreciate any information or guidance you could provide on this matter.
Thank you for your time and assistance.
Regards,
Miller
-
-
July 28, 2023 at 6:52 pm
Guilin Sun
Ansys EmployeeSorry, my reply was gone nowhere.
A1: no, not wrong. It is display and numerical discrete result.
A2: the data is the original data. You need to extract where the material/geometry begins. for example:
clear;
index=getresult("monitor","index");
ind=index.index_x;
nmax=max(ind);
x=index.x;
y=index.y;
plot(x,ind(:,find(y,0)));
linex=ind(:,find(y,0));
aa=find(linex>1);
?x(aa);
This is all the x data for the material.
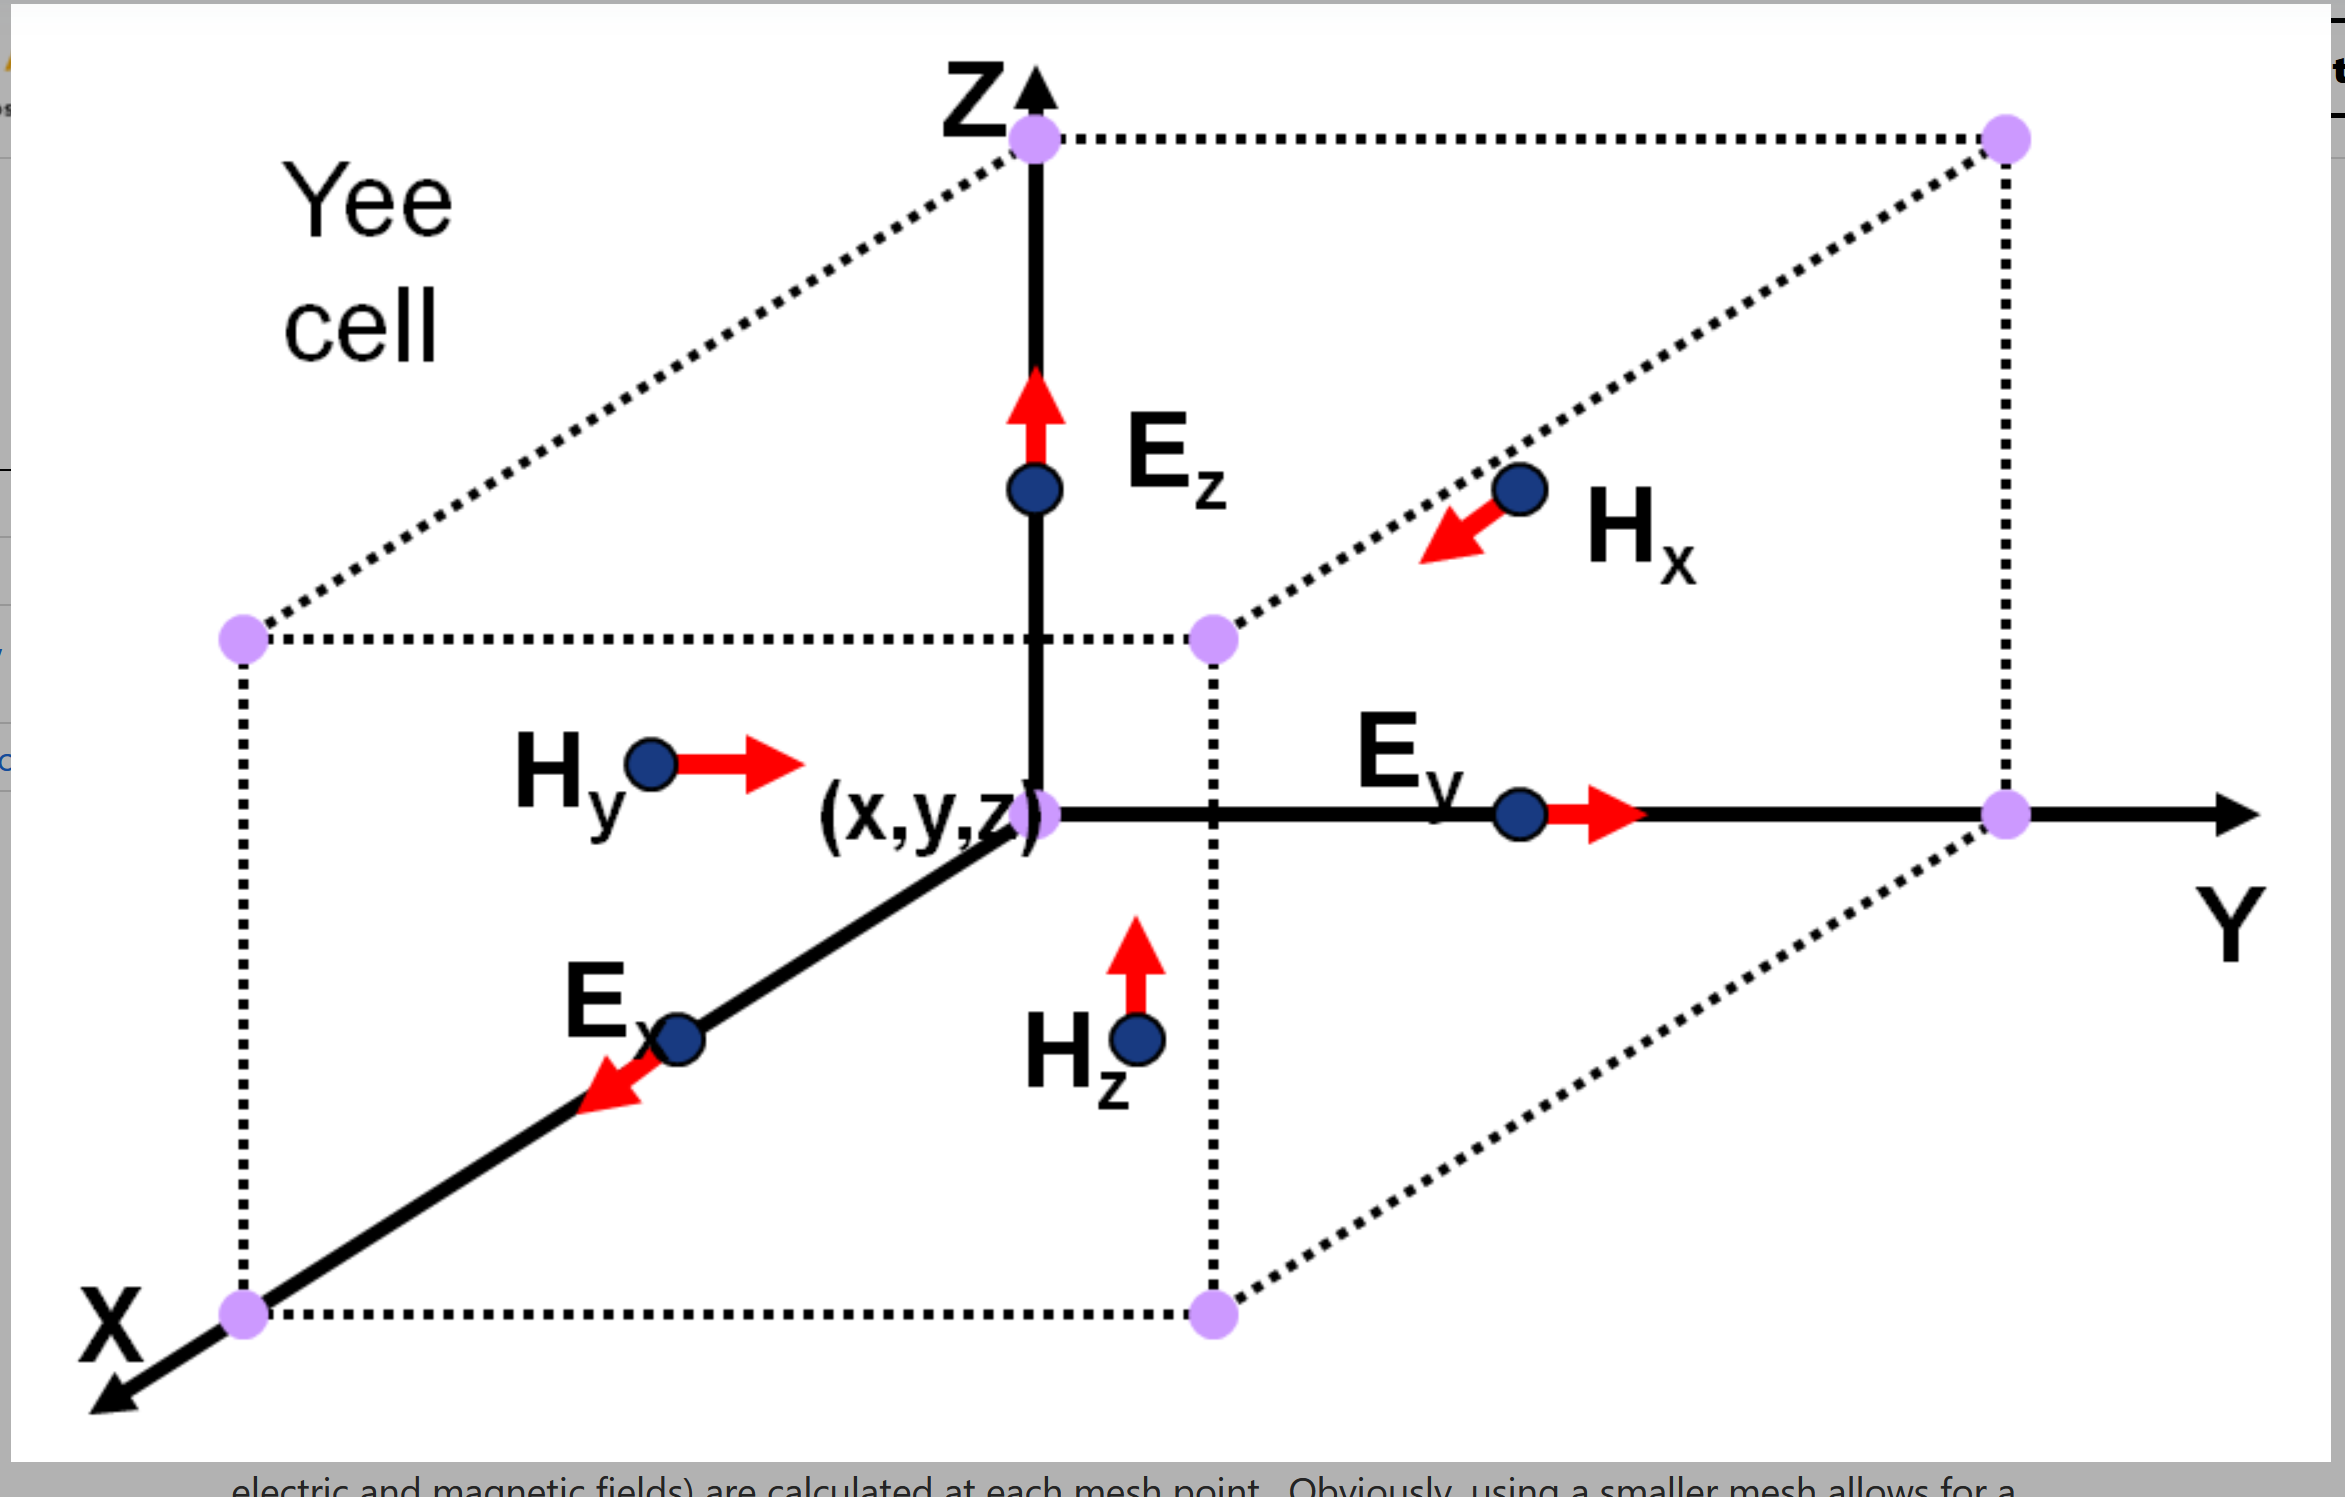
index_x,index_y and index_z are for Ex,Ey and Ez from the Yee mesh, since FDTD makes them displaced in purpose. Inside FDTD, the discrete geometry will look differently from real word.
A3: after discritization the geometry will be different. For visualization FDTD has interpolated them into the same location. Please refer the Yee mesh:
A4: the grids you are referring to is for visualization only. It has no any effect for simulation and discritization.
-
- The topic ‘Import .stl files from prolith to FDTD, scaling factor and parameter problems.’ is closed to new replies.


-
5094
-
1830
-
1387
-
1248
-
1021

© 2026 Copyright ANSYS, Inc. All rights reserved.

