-
-
September 21, 2022 at 8:56 am
csZY
SubscriberHello:
I have two graph like below:
a DPM volume fraction graph and a temperature graph.How do I use fluent to add a DPM volume fraction graph into a temperature graph?
That is, two pictures are superimposed and displayed on one picture.I have tried many times in Fluent,but failed.Can I do this only in fluent?
Thanks.
-
September 21, 2022 at 9:21 am
Rob
Forum ModeratorYou can. In the tree menu (down the left hand side) you want to look in Results>Scene Â
-
September 21, 2022 at 9:39 am
csZY
SubscriberYes,Thank you,Mr Rob.
-
Viewing 2 reply threads
- The topic ‘
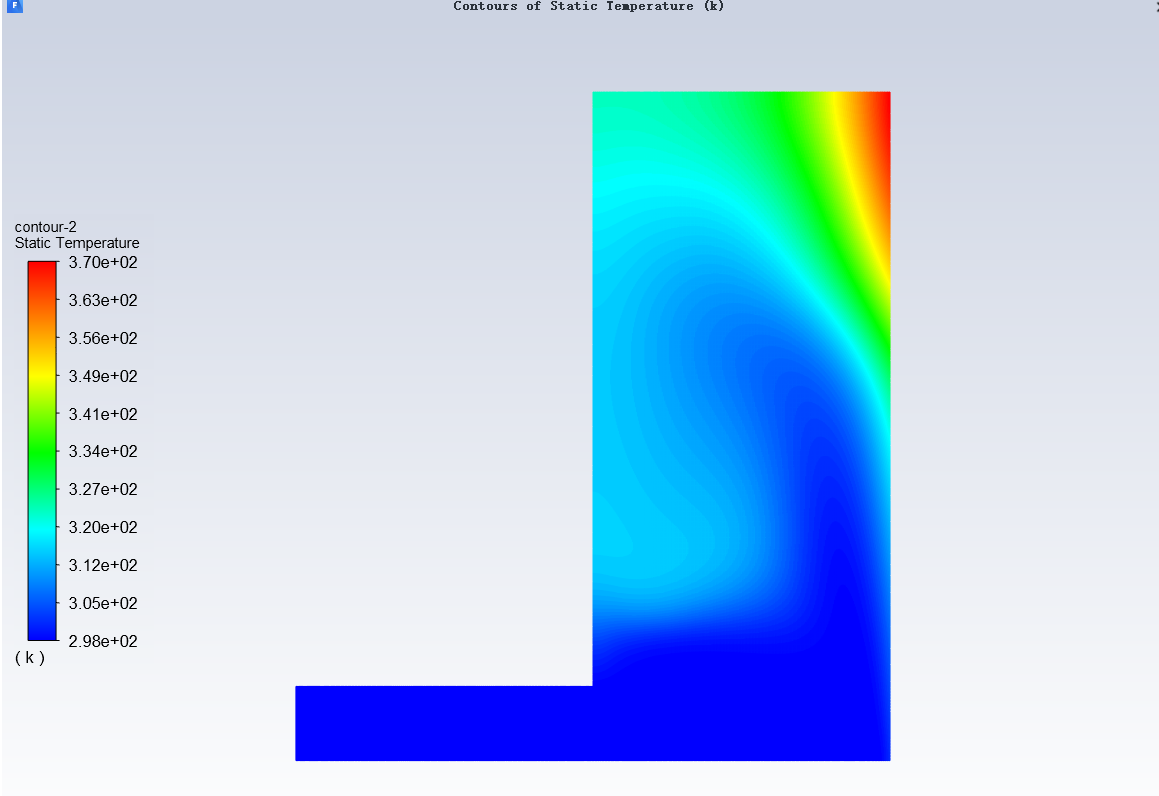
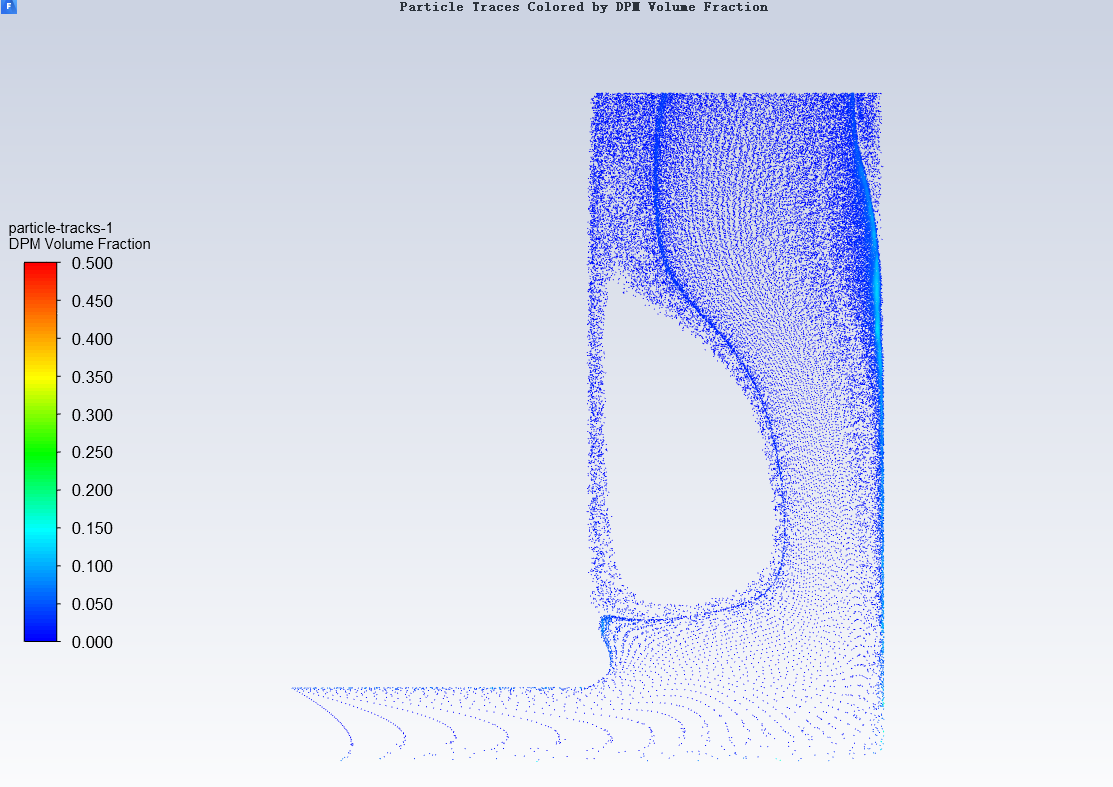
How to use Fluent to add a DPM volume fraction graph into a temperature graph?’ is closed to new replies.
Ansys Innovation Space
Trending discussions
Top Contributors
-
3407
-
1057
-
1051
-
896
-
887
Top Rated Tags
© 2025 Copyright ANSYS, Inc. All rights reserved.
Ansys does not support the usage of unauthorized Ansys software. Please visit www.ansys.com to obtain an official distribution.