TAGGED: grating, metasurface, phase-change, phase-change-materials
-
-
March 12, 2024 at 10:58 am
100521665
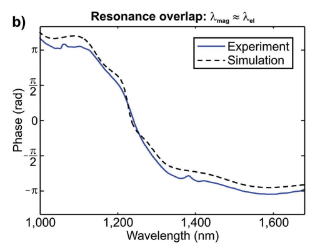
SubscriberI wanted to reproduce the phase figures from Decker et al. (Adv. Optical Mat., 2015) article:
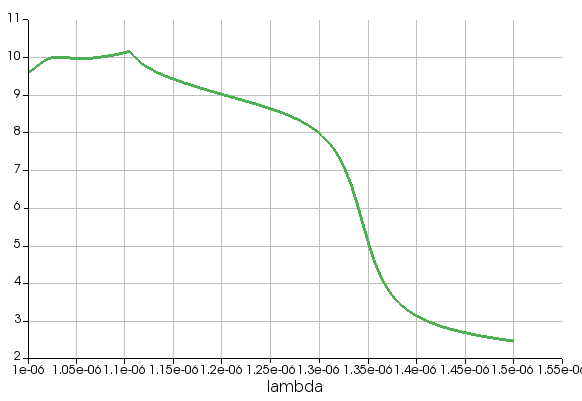
I was given something similar by using the 's_grating_components' script, present in this model:
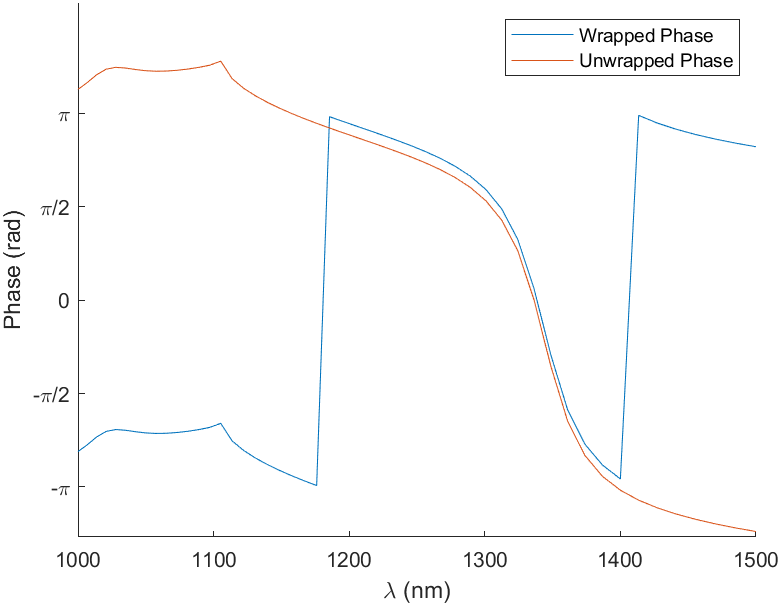
But of course, the units of the phase are not the same. I have already asked for a solution to this issue, and been given to use either the functions unwrap(angle()) or angle(), which do the job by getting the phase isolated for each component:
But I would like to automatically get the green figure, with the appropiate scaling of the phase. In addition, I see that the script is not getting the exact same phase, and I don't see any difference between the model and the figure illustrated in the article. What is the 'shift' in phase due to?
Appreciate your help.
-
March 12, 2024 at 6:55 pm
Guilin Sun
Ansys EmployeeI guess "shift" simply means that you move the reference point.
Phase is a little tough: it is relative. It should have a reference. For broadband source like yours, the phase reference point is usually the angle(E) at the shortest frequency. All other phases are based on this reference value. using unwrap(angle(E)) will lead to phases as a function with frequency without pi change.
If you use angle(E) it will remove the extra Pi phase,like the last graph in your post.
If you change the shortest frequency the phase curve will be changed.
You shuld be ablge to get the phase like the green figure using unwrap(angle(Etheta)) or Ephi.
You can also use a reference point at the center frequency, by deducting its phase from all other phases.
Please try and let me know if you have questions further.
-
March 14, 2024 at 2:10 am
100521665
SubscriberWith the shift I was asking about why the drop of the phase in the article occurs at 1200 nm whereas the one I have simulated does the same at early 1300 nm, could you revise the model and give me some advice over it?.
Besides that, I have come into terms about how to represent the phase. Doing what you mentioned about reaching a center frequency, I recovered this phase (which is I guess what I was looking for):
It was implemented in MATLAB following this criteria:
Where 'ang_unw' is defined as the direct unwrap(angle()) that comes from Lumerical's script. I have added both the .lsf and correspondent figures to the dropbox instance in case you wanted to revise them. What is done through this script, is actually correct? Cause at the end, one still has a graph that is not adequately framed over [pi, -pi], but something that is more or less similar to the unwrapped figure centered over the wrapped figure. To be clear, I want to get the same unwrapped figure, but representing the actual physical meaning, which is the same graph but fitted over the correct range.
-
- The topic ‘How to show phase units appropiately?’ is closed to new replies.


-
4628
-
1535
-
1386
-
1215
-
1021

© 2025 Copyright ANSYS, Inc. All rights reserved.


