
-
-
September 20, 2021 at 1:35 pm
Shauna
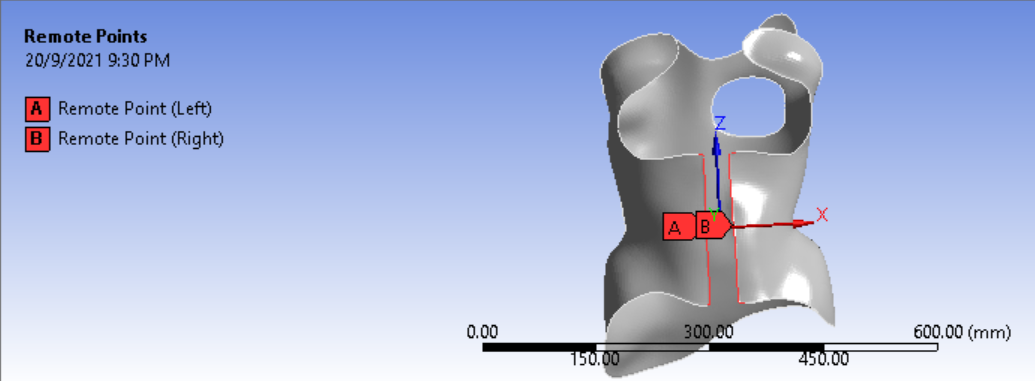
SubscriberHi all, I am new to ANSYS and I need help in using the software. I have a scoliosis brace model that I am suppose to obtain the force and displacement results at the opening of the brace. I have placed two remote points at each edge of the brace opening.
September 20, 2021 at 2:51 pmmrife
Ansys Employeewhat is the applied load? The applied load could be a load in the normal sense i.e. a force, pressure, gravity, etc. Or an applied non-zero displacement.
When postprocessing results, if the Time of the analysis can be set to the load amount, then any result "Graph" view (center of UI right below graphics region) will show the result vs time (or in this case vs load) graph. This is kind of a 'trick' that may not be feasible depending on the load steps and if time is actually needed. For a normal postprocessing use the Chart tool:
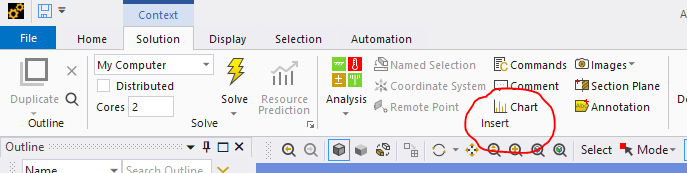 Select one or more result objects, then insert a chart. Then the chart properties in the details can be changed such that the X axis is not time, but one of the result quantities.
Mike
Viewing 1 reply thread- The topic ‘How to plot force vs displacement?’ is closed to new replies.
Ansys Innovation Space Trending discussions
 Top Contributors
-
peteroznewman
 3139
3139 -
javat33489
 1007
1007 -
scabo
 923
923 -
Shyam Prasad V Atri
 858
858 -
adib.aktab999
792
Top Rated Tags
© 2025 Copyright ANSYS, Inc. All rights reserved.
Ansys does not support the usage of unauthorized Ansys software. Please visit www.ansys.com to obtain an official distribution.
-


The Ansys Learning Forum is a public forum. You are prohibited from providing (i) information that is confidential to You, your employer, or any third party, (ii) Personal Data or individually identifiable health information, (iii) any information that is U.S. Government Classified, Controlled Unclassified Information, International Traffic in Arms Regulators (ITAR) or Export Administration Regulators (EAR) controlled or otherwise have been determined by the United States Government or by a foreign government to require protection against unauthorized disclosure for reasons of national security, or (iv) topics or information restricted by the People's Republic of China data protection and privacy laws.


