TAGGED: maxwell
-
-
February 1, 2022 at 4:50 pm
H2020
SubscriberHi,
I am trying to see the magnetic field distribution on a sheet for a simulation model right now. However, the Mag_B that is plotted contains all components. Is there a way to only plot Mag_B with the X, Y or Z component?
best,
H2020
February 2, 2022 at 11:18 amNKC
Forum Moderator
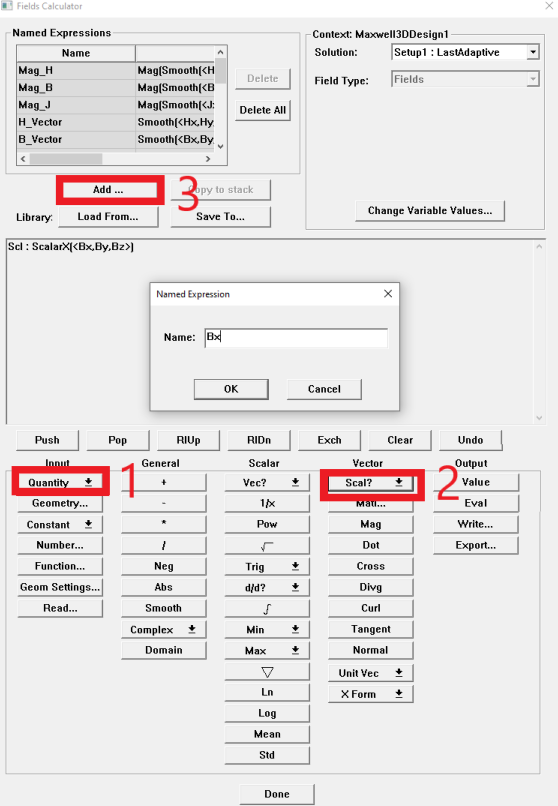
you can create a polyline as the circular path (OR any path you want) first -> use field calculator to create named expression Bx
In field calculator, Input: Quantity->B
Vector: Scalar?->ScalarX
Add..->Type the name as "Bx"
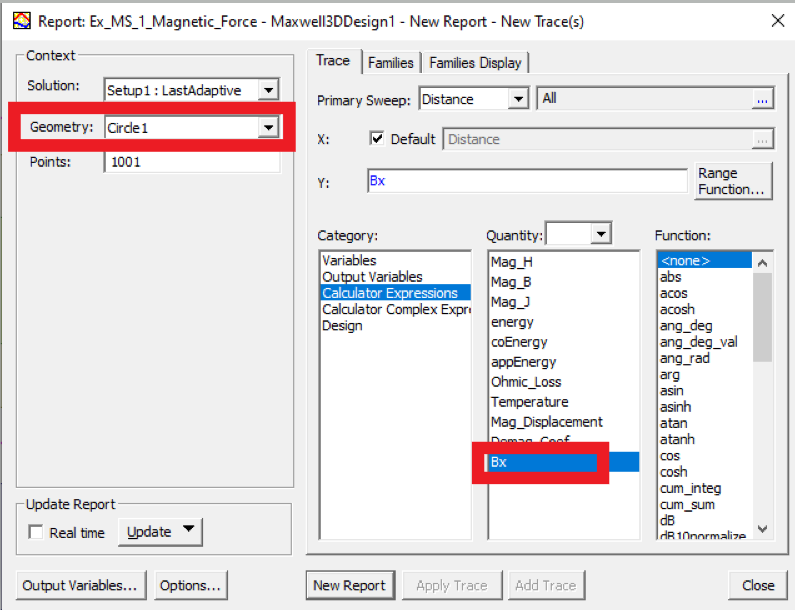
 Create a field report-> select the circle(or the path you crated) in geometry ->add Bx from Calculator Expressions->New report
 Regards
Navya
February 2, 2022 at 2:40 pmH2020
Subscriber
Thanks for the reply. I followed your instructions and plotted a field overview of the scalar X component. Is is necessary to apply the smooth() and Mag() commands to your code as well? Since those are the operators used on the Mag_B expression as well.
Best H2020
Viewing 2 reply threads- The topic ‘How to plot field overlay of X component of Mag_B?’ is closed to new replies.
Innovation SpaceTrending discussionsTop Contributors-
4708
-
1565
-
1386
-
1242
-
1021
Top Rated Tags© 2026 Copyright ANSYS, Inc. All rights reserved.
Ansys does not support the usage of unauthorized Ansys software. Please visit www.ansys.com to obtain an official distribution.
-


