-
-
March 22, 2024 at 12:42 pm
Masataka Ando
SubscriberI am doing 3D FDTD simulation on Ansys Lumerical 2021 R1.2 Finite Difference IDE.
i want to output data of e2 as a 2D array. the desired data can manually be obtained by exporting the data when, selecting the TimeMonitor from the "Objects Tree", selecting visualize > E, changing the "Scalar operations" to abs2 and double clicking "view data. i can get data of different times by manually changing the value of "t" on "Parameters".
I want to achieve this automatically by using lsf script.
i was able to output the data to e2 when the index of the parameter "t" is 1 by using the script below.
E = getresult("monitor1","E");
E_2=E.E2;
How can I save the results of |E|^2 when the index of the parameter t is other than 1?
-
March 22, 2024 at 6:06 pm
Guilin Sun
Ansys EmployeeYou have already got E2 the intensity, which is a 4D matrix: xyz and time.
You can use “pinch” to remove the singleton dimension. pinch – Script command
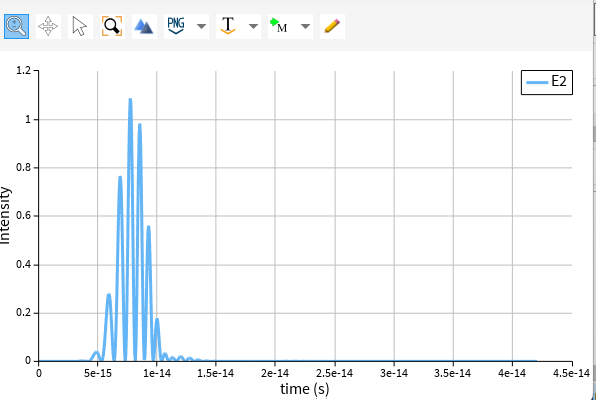
if you are using a point time monitor, after “pinch”, it will be a 1D matrix, which is the time.
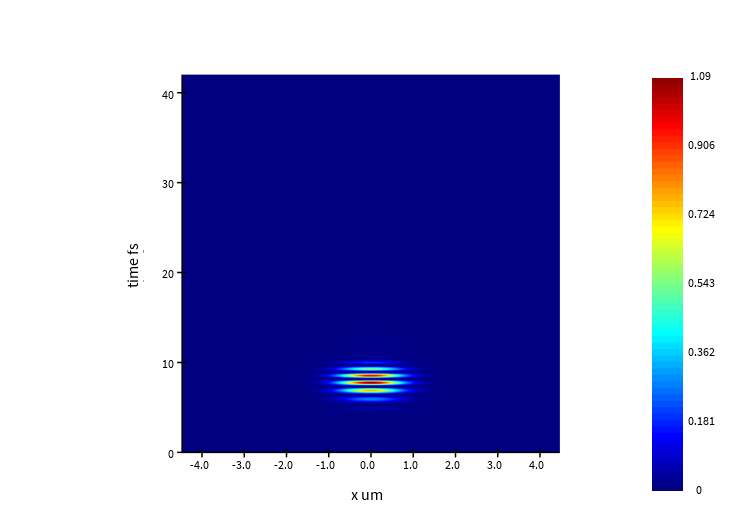
If you use a line time monitor, the result will be 2D.
E = getresult(“monitor_1″,”E”);
E_2=E.E2;
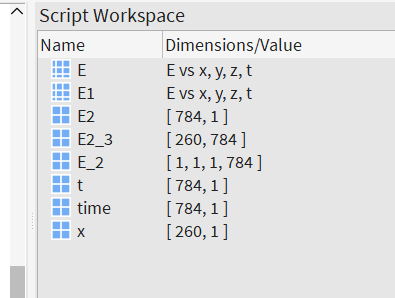
E2=pinch(E_2);
time=E.t;
plot(time, E2,”time (s)”,”Intensity”);
E1 = getresult(“monitor_3″,”E”);
E2_3=pinch(E1.E2);
x=E1.x;
t=E1.t;
image(x*1e6,t*1e15,E2_3,”x um”,”time fs”);
you can save the result in ldf format: savedata – Script command
or matlab format: matlabsave – Script command
txt format: write – Script command
As for the data, you can simply save the dataset, which will be easy for you later, or each of the data matrix, eg, E2,x,t etc.
-
- The topic ‘How to output TimeMonitor result by using script’ is closed to new replies.


-
4673
-
1565
-
1386
-
1236
-
1021

© 2025 Copyright ANSYS, Inc. All rights reserved.


