-
-
May 14, 2024 at 8:07 am
yanshengshao67
Subscriber#question
Hello Teachers!
I am simulating a paper on the incidence of circularly polarized light and the reflection of vortex light. I can get the incidence of circularly polarized light through the Settings in my diagram, but I am not very clear about the result of the emission. I have the following questions:
1. I would like to ask how to observe the phase curve of the reflected circularly polarized light?
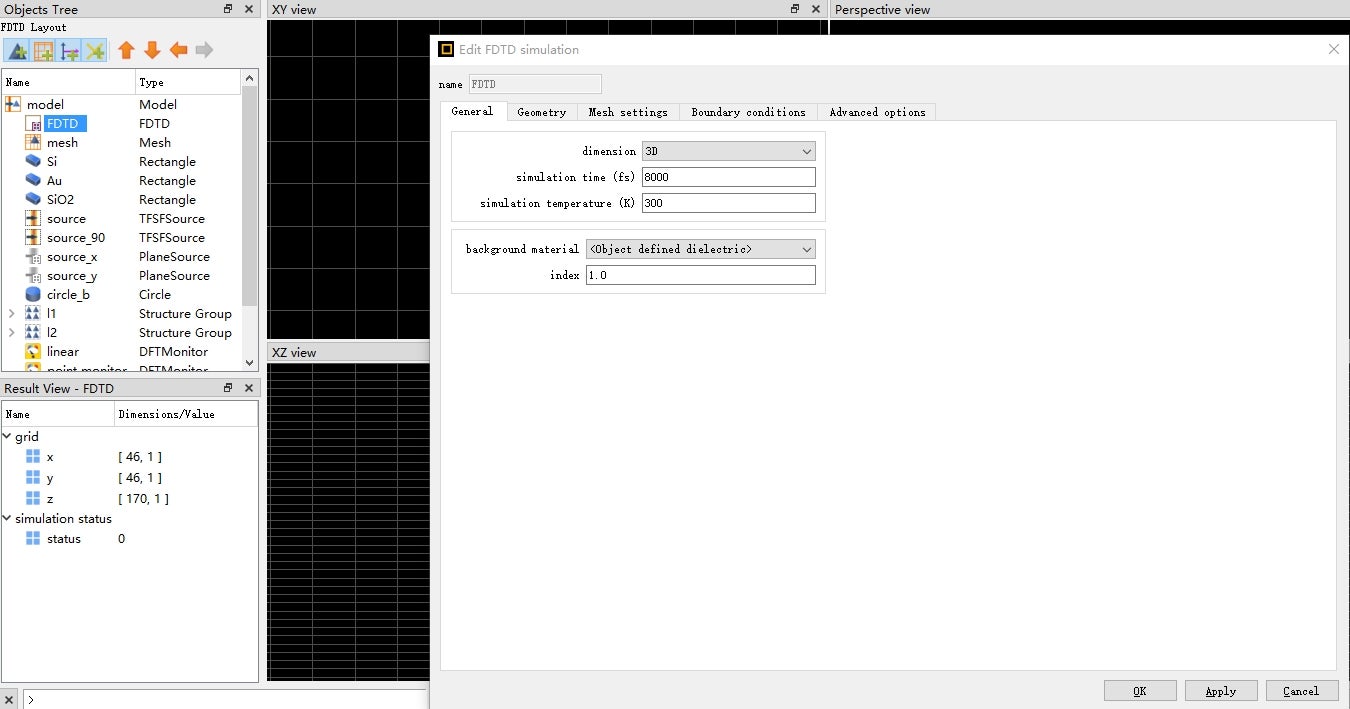
2. The light source I use is TFSF, the energy of the light source is not completely attenuated, but the trend of the curve is generally the same, that is, the amplitude is a little large. May I ask whether I should extend the simulation time (currently 3000fs)?
Looking forward to your reply!
Thank you! -
May 14, 2024 at 8:53 am
-
May 14, 2024 at 6:17 pm
Guilin Sun
Ansys EmployeePhase is always with a field component. Sometimes all the field components can have the same phase. Othertimes it might be different. Usually we know how to write a linear polarization with phase. For circular olarization since it is composed of two linearlly polarized light, you will need to decompose the monitor fields (or farfield) into the circular polarization, the coefficient will have a phse, which can be regarded the phase of that circular polarization. details will need you to do the decomposition.
In addiion, from the second screenshot, it seems you will need to set longer simulation time, and let the autoshutoff min to terminate the simulation. Please refer to this post:
Ansys Insight: 为什么说仿真时间要足够长才能得到正确的频域结果
Sometimes longer simulation time may not improve the amplitude of the result. It might mean other wavelengths in the pulse have larger power than the expecrted wavelength range.
Since this is a periodic structure with periodic BCs, please use plane wave, if you do not have a strong reason to use TFSF.
-
May 15, 2024 at 8:49 am
yanshengshao67
SubscriberThanks for your reply!
I took your advice to set the light source to a plane wave, but I didn't get the results I wanted. However, under the TFSF light source, the overall trend of my amplitude curve is somewhat similar, so I wonder whether he is the TFSF light source. If yes, then I extended the simulation time to 8000fs, and the result was that the energy was stable around 0.003 and did not decay. Do you still need to extend the simulation time?
Also, I would like to know how to decompose the monitor field into circular polarization?
Look forward to hearing from you and thank you in advance! -
May 15, 2024 at 5:19 pm
Guilin Sun
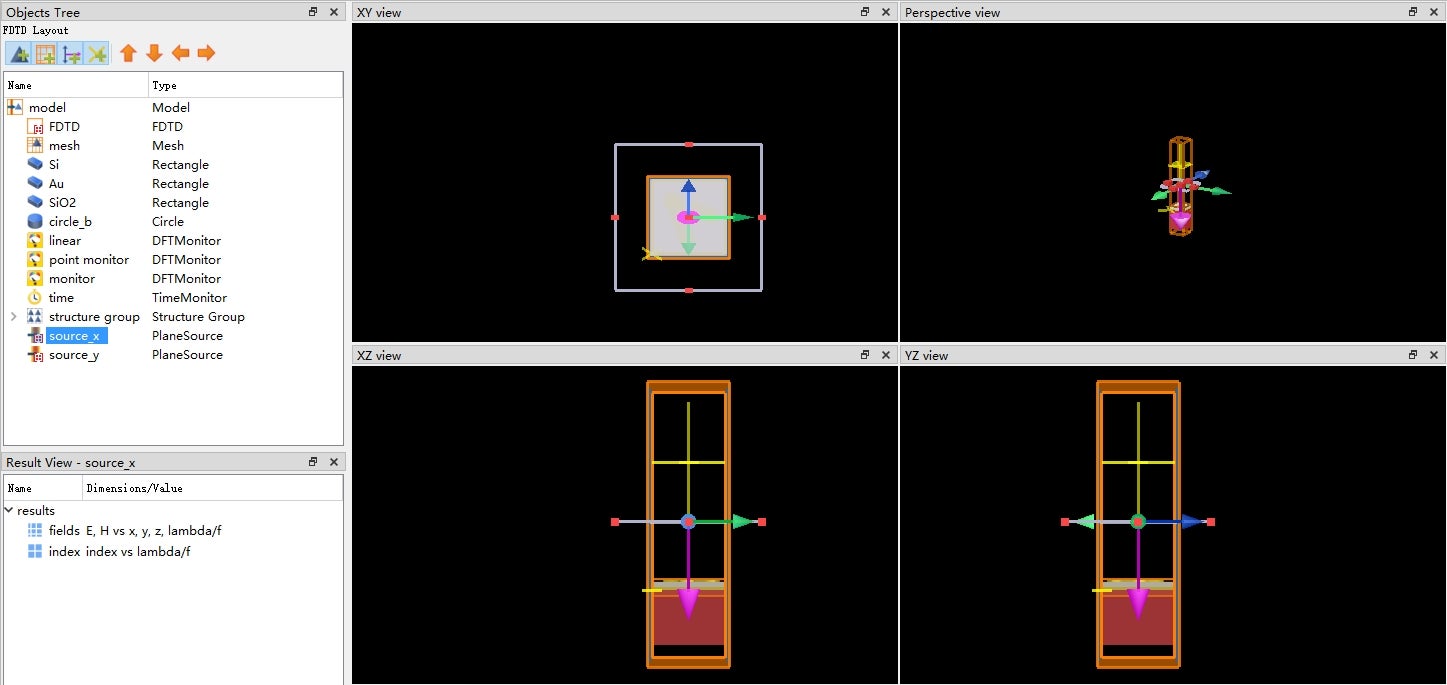
Ansys EmployeeFirst, TFSF is a kind of "local" plane wave that inside the total field region (the source volume) it is a plane wave. Outside this region it is scattered field. When you set the TFSF area larger than the periodicity, it acts the same as a plane wave.
"the energy was stable around 0.003 and did not decay." this indicates that either there is very strong resonance, or PML reflection. To confirm it is resonance, please use a time monitor and check the spectrum and see if there is any strong resonance within the interested bandwidth (the source band). If yes, you may need to increase the simulation time and reduce autoshutoff min as suggested previously. If the strong resonance is outside the source band, you can set the source in time domain: use longger pulse with larger offset.
Please use the definition of circular polarization to decompose the monitor field, if it has no higher order diffraction. You can use visualizer to get the farfield with assuming 10 periods. If it has higher order diffraction, you may need to use grating analysis to get the 0th order and do the decomposition.
-
May 16, 2024 at 8:09 am
yanshengshao67
SubscriberThanks for your reply!
Unfortunately, I just started the simulation of FDTD recently, and my electromagnetic foundation is relatively weak, so after some attempts, I still have several questions I would like to confirm with you:
1. You said that if TFST is larger than periodic, its action is the same as that of a plane wave. Here, I expanded its range by 30nm and its structure by 30nm. The problem of energy attenuation has indeed been solved, but the simulated curve will have many peaks, I don't know whether they are diffraction peaks.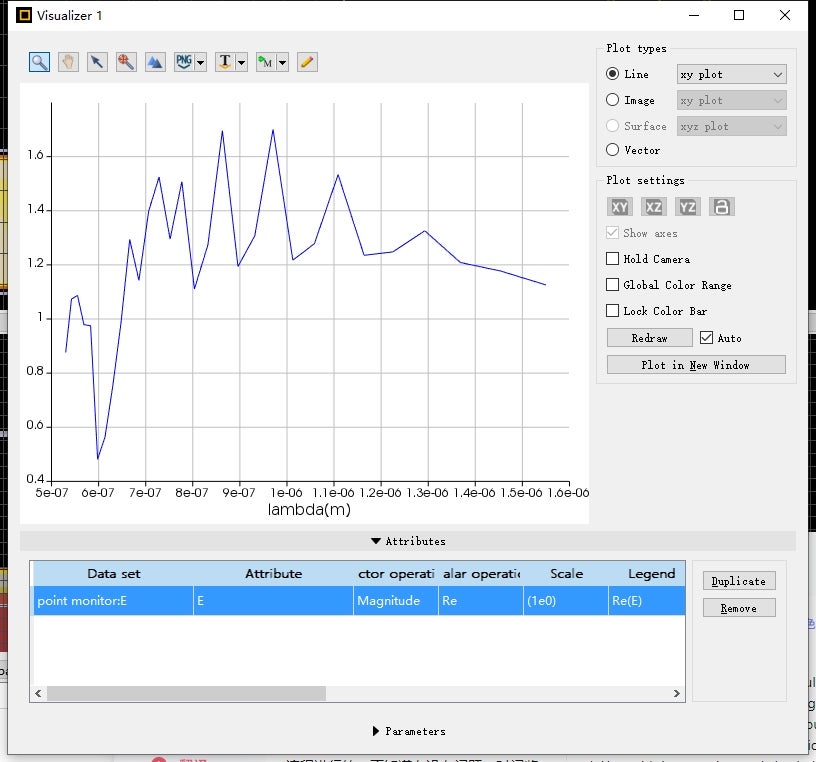
2. I scaled the TFSF to the original coverage area (the same size as the structure) and checked the spectrum of the time monitor you mentioned. I followed the following process, I wonder if there is any problem: Time monitor -> Visualizer -> spectrum. If there is no problem, I will leave the screenshot below. There is indeed obvious resonance in the band I am interested in (530nm-1550nm), and I am also conducting simulation according to what you said, extending the simulation time to 10^4fs and reducing the autoshutoff min to 10^-6.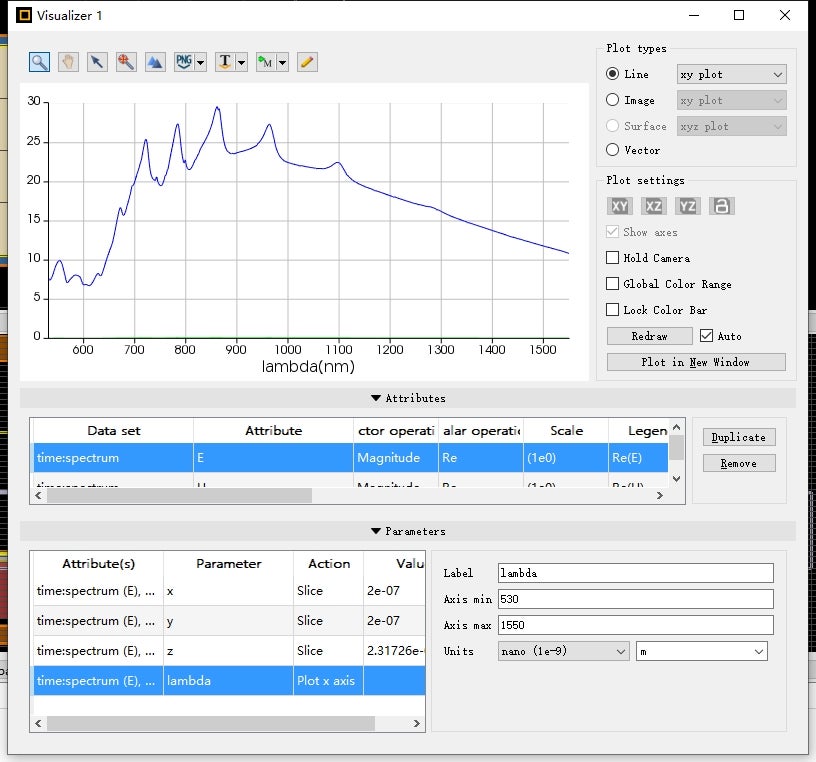
3. Regarding the phase problem of circular polarization, I know that circular polarization can be composed of two linear polarization with a phase difference of pi/2, but I do not know how to use FDTD to operate, can you tell me some specific operations to solve the phase of circular polarized light?
Thank you, teacher. Look forward to hearing from you -
May 17, 2024 at 6:25 pm
Guilin Sun
Ansys EmployeeYou can get more knowledge here:
Total-Field Scattered-Field (TFSF) source - Simulation object
Tips and best practices when using the FDTD TFSF source
Please set the TFSF XYspan mcuh larger than than the poeriod.
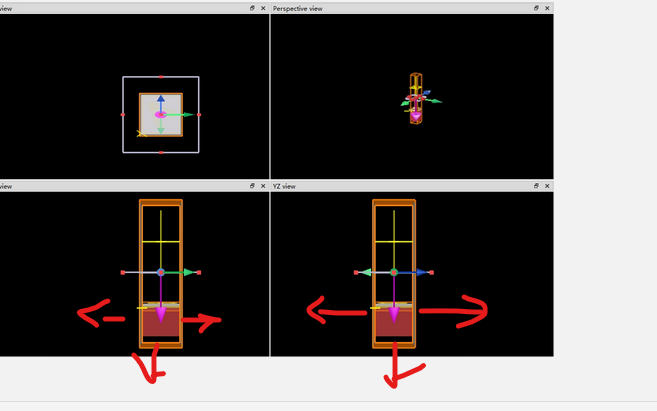
The problem you have is, the substrate should also be modified:
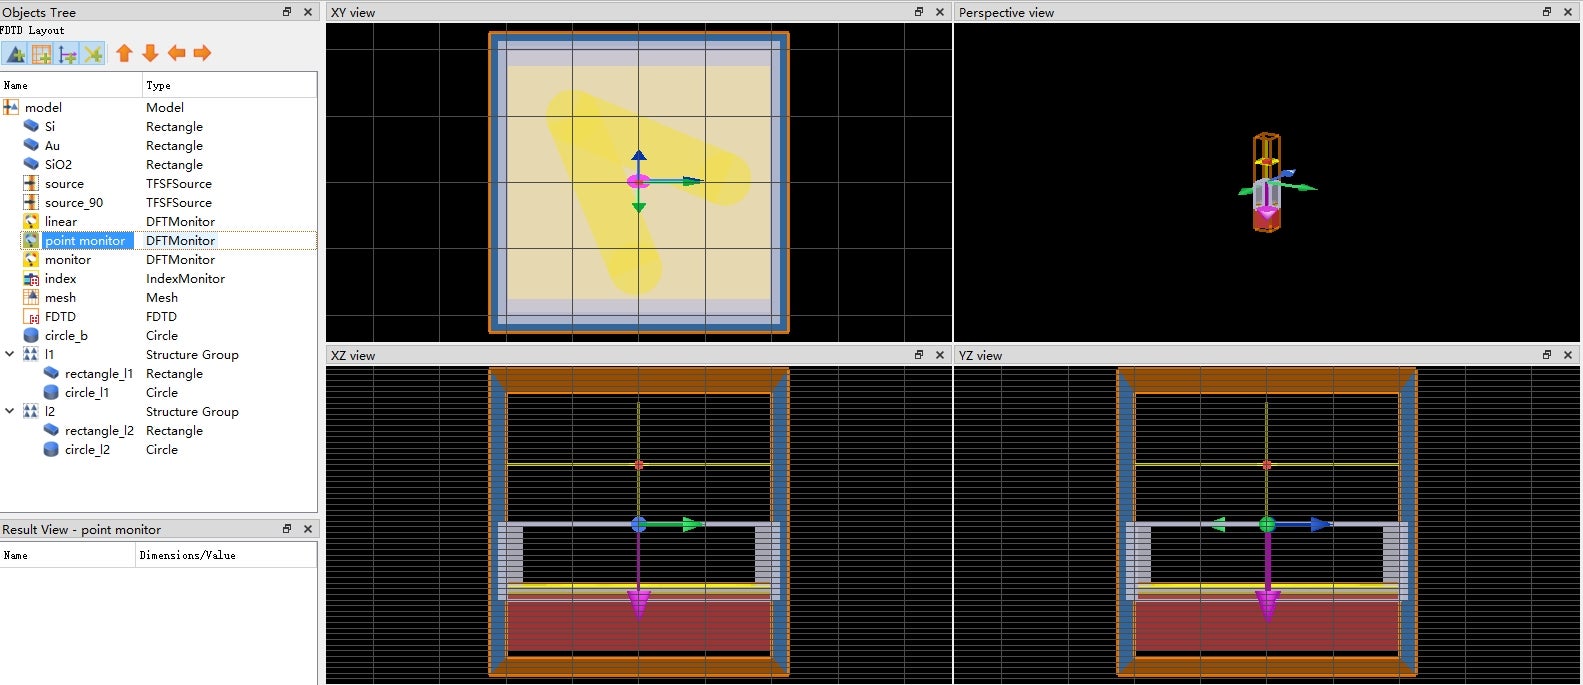
xy span must be expanded to outside of the periodic boundary; and zmin must be outside of PML. Currently you are simulating substrate as cavity since its bottom surface is not expended to outside of PML, which will lead reflection.The 2nd one does not have any issue.
Could you please let me know why you want to use TFSF? you can simply use regular plane wave.
For source with circular polarization, you can add two linear polarization, change one of polarization angle to be 90deg. they will be orthogonal. Once you have those two, then follow the common definition eg, same amplitude, phase difference 90deg (can be one is zero, the other is 90deg), it will work as a circular polarized source. Please refer to Circular polarization and phase convention
Please focus on one issue. Resolve the problem one by one, and one in one post.
-
May 19, 2024 at 6:03 am
yanshengshao67
SubscriberThank you for your reply!
Sorry to reply you so late, teacher. Because I have so many questions, I have followed several questions under one post. I'll take care of that later.
1. Thank the teacher for the resources provided. I will modify the TFSF according to your suggestions, and then give you feedback.
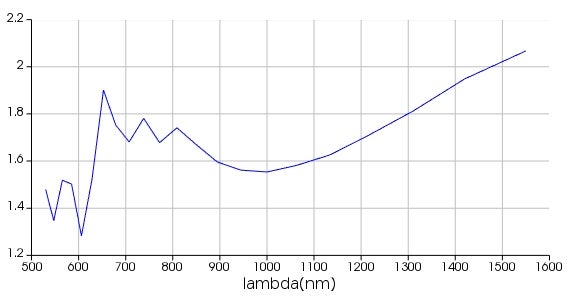
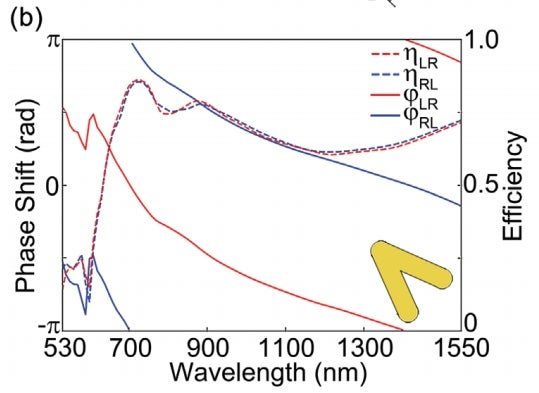
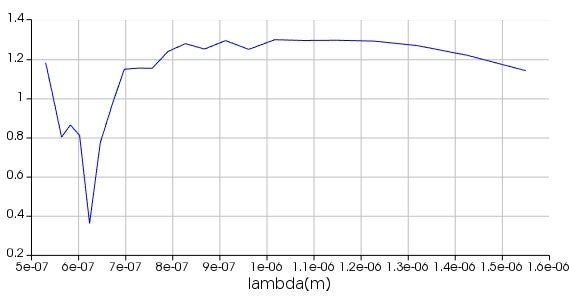
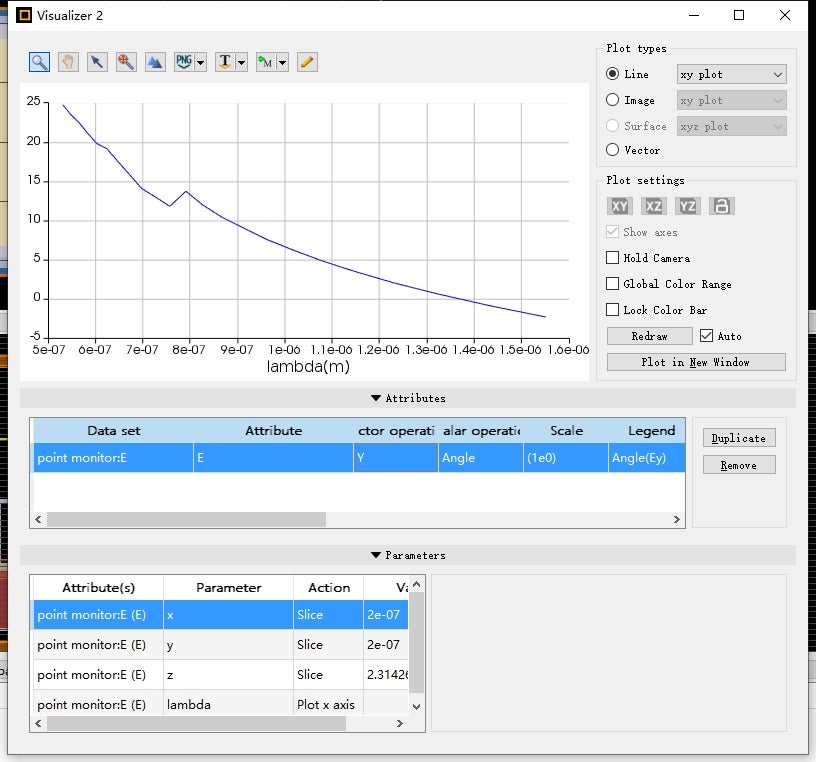
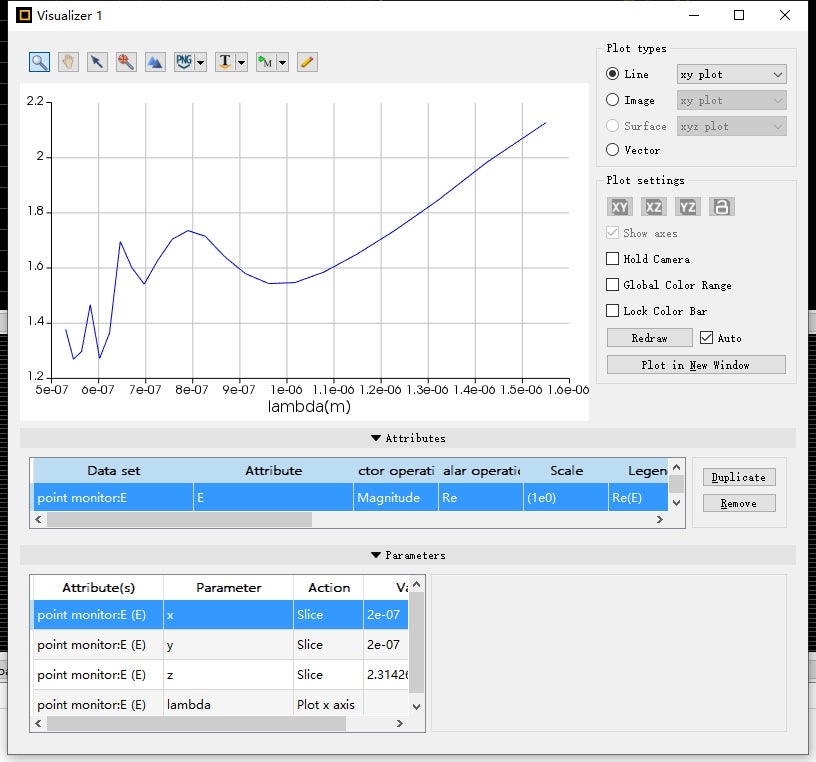
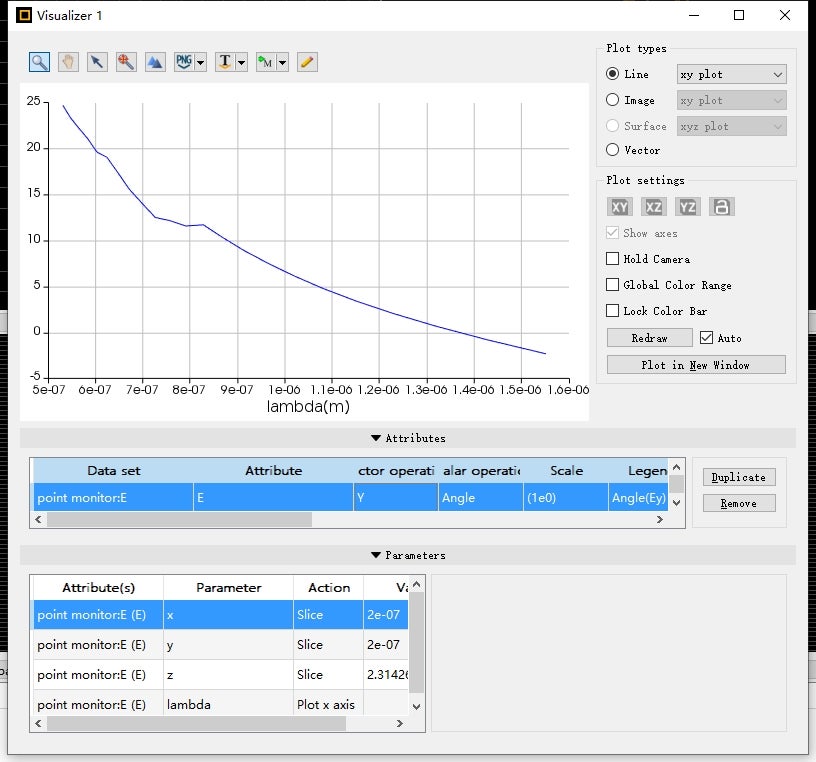
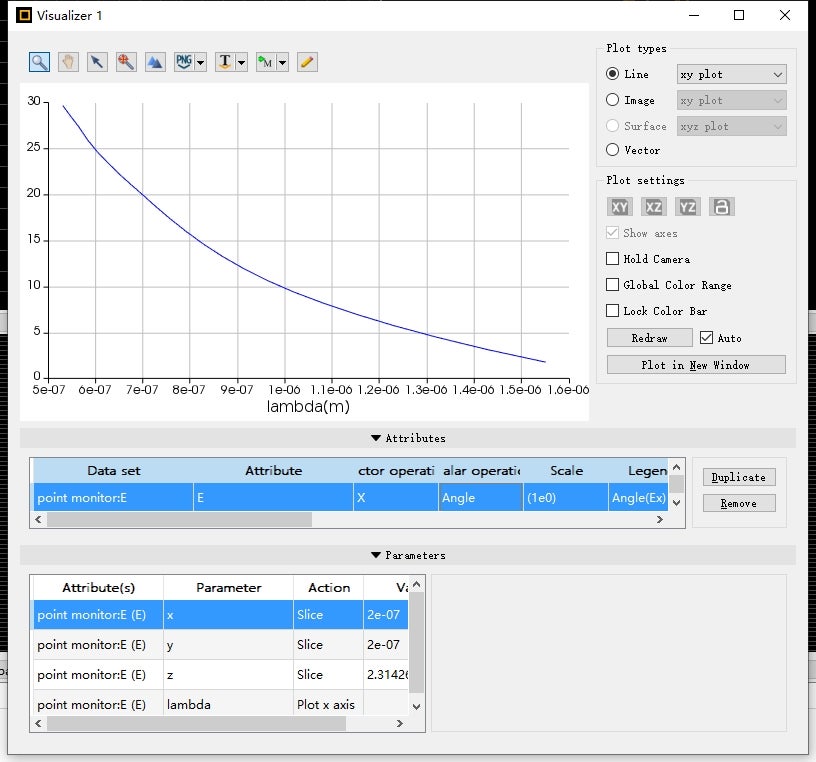
2. The reason why I use TFSF is that when I use plane waves, I can't get the curve I want to simulate, and even the result is not like my target at all. Although the result is not exactly the same, the general trend of the curve is correct. I can show you the result diagram I ran with TFSF. The first diagram is the amplitude I ran with TFSF, the second diagram is my target diagram, and the third diagram is the diagram I ran with planewave, which may also be the wrong model I built with planewave. So, the fourth picture is that the plane wave model I used was wrong, or something. I hope you can give some suggestions for revision.
Looking forward to your reply, thanks in advance! -
May 19, 2024 at 12:06 pm
yanshengshao67
SubscriberTeacher, I would like to add my reasons for using TFSF:
In the second picture you saw in the previous post (target result), the right side is the normalized amplitude, and the left side is the phase of circular polarization. The amplitude I used TFSF to run out is as shown in the first picture (target result), and the phase is in the following figures.
Although I don't know how to get a result like the target graph, I can vaguely feel that TFSF can get the result I want. -
May 19, 2024 at 12:41 pm
-
May 20, 2024 at 12:00 am
yanshengshao67
SubscriberTeacher, I have added circularly polarized light, but I can’t use the amplitude and phase of the linearly polarized light component to find the amplitude and phase of the circularly polarized light component, can you tell me what I should do? Thank you, teacher
-
May 20, 2024 at 2:48 pm
Guilin Sun
Ansys EmployeeFor the decomposition of the circular polarization, it is simply by definition. Please check some reference as this is a theoretical question.
For simulation, it is coincidence that your TFSF gives "looking" similar results. The project file has definiciency as you did not extend the substrate:
Please modify as suggested.
Ansys Insight: 我的仿真结果为什么与文献或实验结果不一致?
Please write a new post if you have questions, as I will take long vacation and your post will not be replied.
-
- The topic ‘How to observe the phase of circularly polarized light’ is closed to new replies.


-
5089
-
1823
-
1387
-
1248
-
1021

© 2026 Copyright ANSYS, Inc. All rights reserved.

