There are two ways you could do this:
Method 1 - 'Near Field' Report
1a) Create a new relative coordinate system where the XY plane is aligned with where you want the 2D contour plot.
1b) Create a 'Near Field' setup by right-clicking on 'Radiation' in the project tree and selecting 'Insert new Near field setup' and then 'Rectangle'.
1c) In the window that pops up, specify the new relative CS from the drop down menu and specify the extents and sampling density in each axis. - The UV vectors align with the XY plane of the specified coordinate system (which is why we had to make sure the new relative cs created in the first step has it's XY plane aligned with the plane that you want to plot)
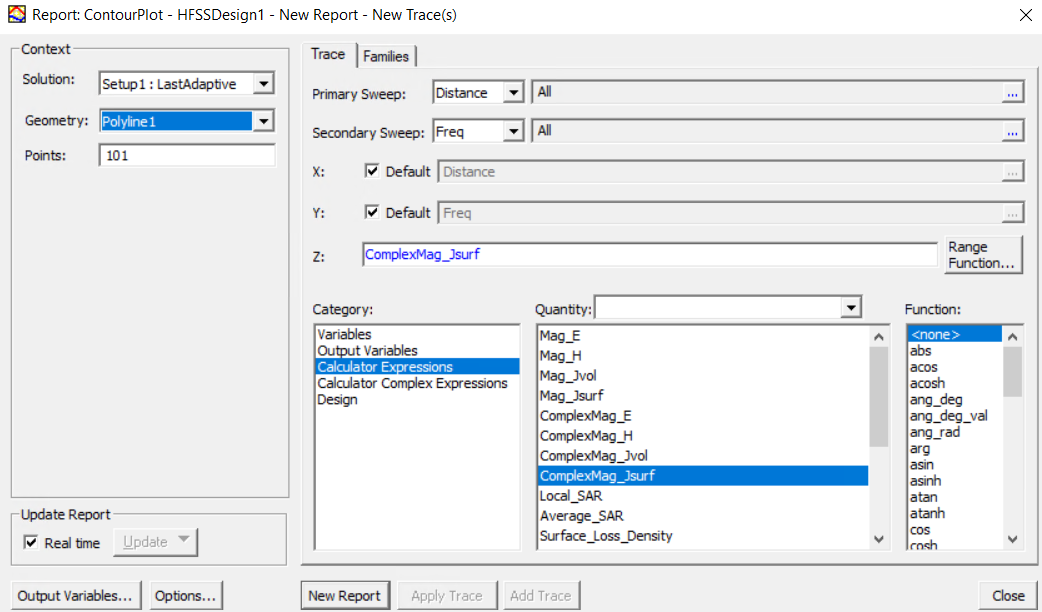
1d) To make the 2D contour plot, right-click on results and then 'Create Near Field Report' (not 'Field Report') and then select rectangular countour plot
1e) the plot settings will pop up and for the 'geometry' you can now select the 'Rectangle' defined in step 1b
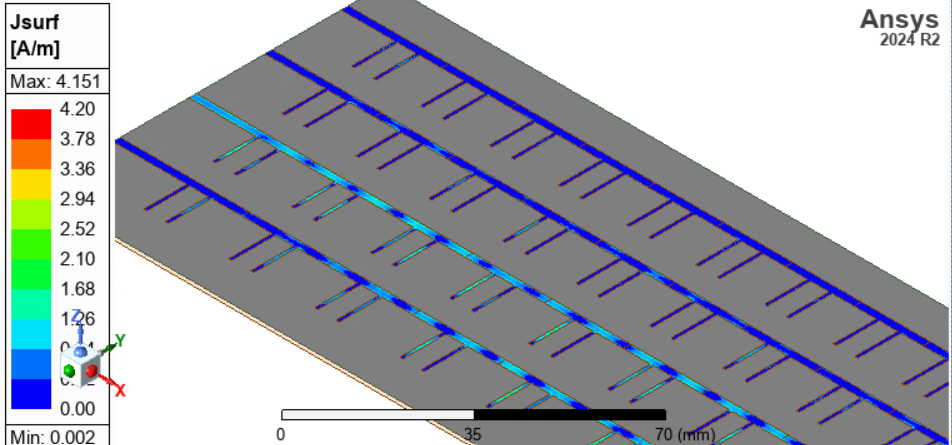
1f) Optional step: after the report with the plot is generated, if you double click on the color bar, it will open the plot settings, and in the 'contour' tab, if you set the 'IsoValType' from 'Line' to 'Tone', it will fill in the plot to make it look solid like a typical field plot on a 2D plane.
Method 2 - Export raw field data from the 'Field Calculator'.
2a) Enter the Field calculator from [HFSS > Fields > Calculator...]
2b) select the desired expression and then 'copy to stack' (or create your own expression)
2c) with the desired expression in the stack, press the 'export' button (towards the far right under 'output')
2d) from this window you can specify the min/max bounds and sampling size for each axis... and it will write out all the field data in the specified region to an ascii text file which you can parse later to plot in python, matlab, or some other external tool... to specify sampling on a 2D surface, just set the third axis to have a 0mm step size with the same start and stop dimension...
For more information about how to use the HFSS field calculator, do a google search for the 'HFSS Field Calculator Cookbook PDF'. It is a very old PDF but still has a lot of information about how to use the field calculator...