-
-
December 4, 2023 at 9:39 am
BALA
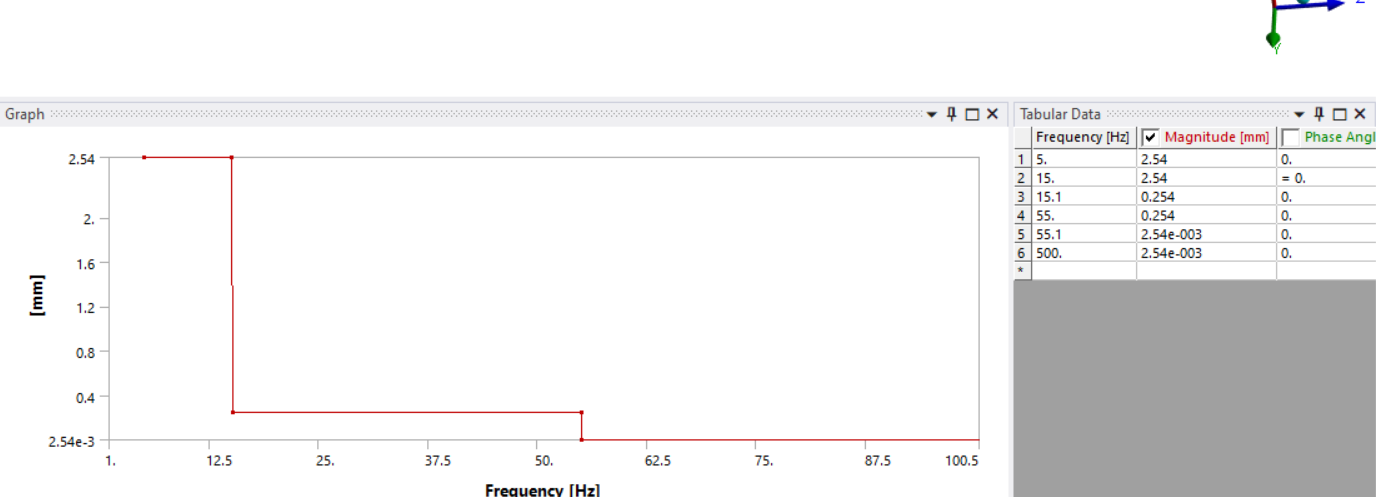
SubscriberHello all , I am performing Harmonic Analysis where my loading is variable with frequency which is in form of following tabular form (Base Excitation). Is anyone have any idea how to give this in ansys Mechanical Harmoic Analysis.
Frequency
Amplitude (Displacement)
10
2.54
20
2.54
20
0.254
65
0.254
500
0.002454
-
December 4, 2023 at 1:41 pm
-
December 11, 2023 at 8:58 am
BALA
SubscriberThanks for your reply, I tried the option you suggested and it worked, the only problem i am facing is the graph is not showing total range.
-
December 11, 2023 at 3:05 pm
danielshaw
Ansys EmployeePlease insert an image of the graph and table.
-
December 13, 2023 at 6:37 am
-
December 13, 2023 at 2:49 pm
danielshaw
Ansys EmployeeI do not know. I cannot reproduce that behavior.
-
Viewing 5 reply threads
- The topic ‘How to give Frequency vs Amplitude (Displacement) Tabular data In Harmonic Analy’ is closed to new replies.
Ansys Innovation Space


Trending discussions


Top Contributors


-
3792
-
1388
-
1188
-
1095
-
1015
Top Rated Tags


© 2025 Copyright ANSYS, Inc. All rights reserved.
Ansys does not support the usage of unauthorized Ansys software. Please visit www.ansys.com to obtain an official distribution.


