TAGGED: psd
-
-
May 26, 2025 at 3:50 pm
kristan.sears
SubscriberThe best information I can find on this topic is in this post:
https://innovationspace.ansys.com/forum/forums/topic/in-random-vibration-analysishow-to-define-psd-curve/
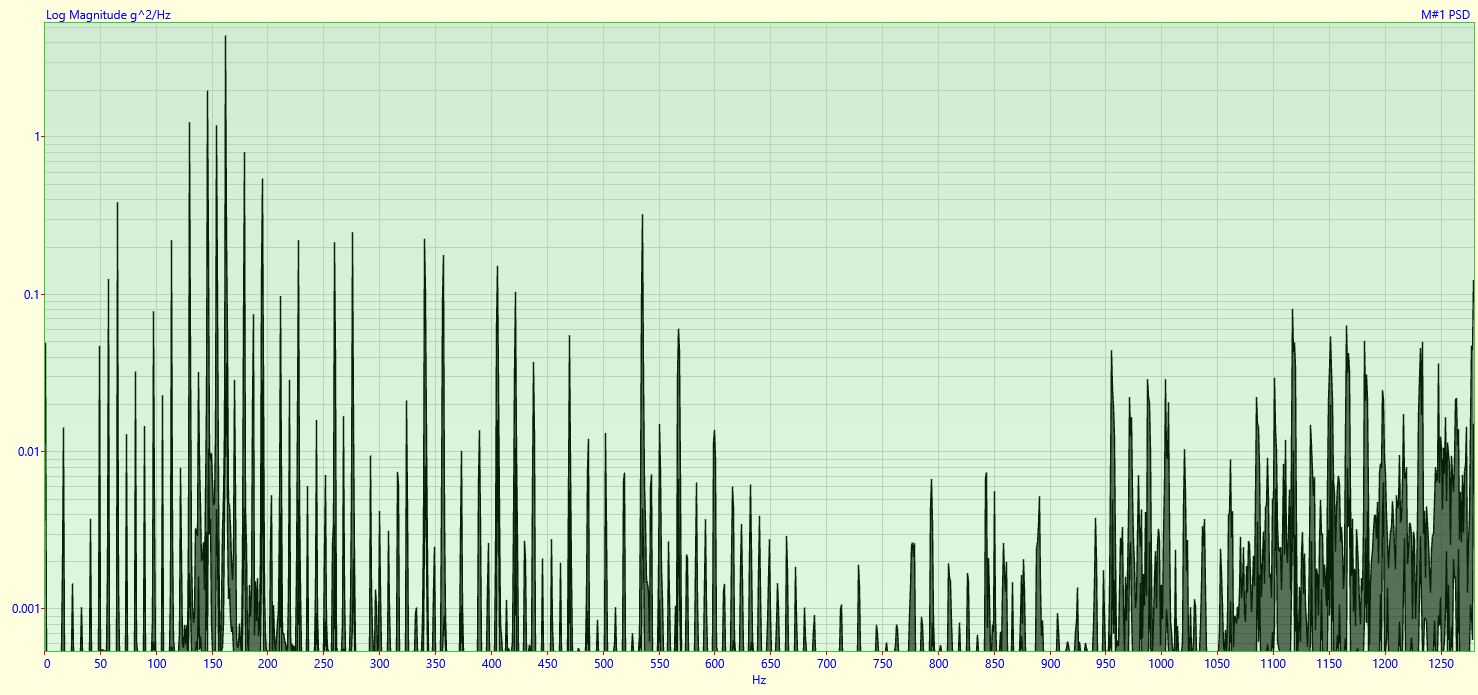
However, I have a time waveform that I used to generate the FFT. From there, I can generate a PSD, but it looks nothing like the three lines/four points in the above referenced post. So, my question is, how do I go from the spectrum (g^2/Hz) below to the linear input curves referenced above?
-
May 27, 2025 at 3:19 pm
dlooman
Ansys EmployeePerhaps you could just create an input PSD that envelopes the peak values of the FFT result you show.
-
May 27, 2025 at 3:44 pm
kristan.sears
SubscriberYes, I could do that. Is that the most common/practical way to apply the time waveform data? When I generate a PSD from the FFT, I end up with the correct units g^2/Hz, but it's another spectrum, as shown above, not a curve. How does the trapezoidal curve represent real random vibration compared to the spectrums from actual data? Inputting the PSD spectrum is too many data points to be practical.
-
May 27, 2025 at 4:13 pm
dlooman
Ansys EmployeeI'm not sure how your plot was created from the FFT and why it's not more continuous. If the meaning of the data is the same as a PSD, that is, every point is the variance of acceleration associated with a unit frequency interval, then enveloping it seems appropriate.
-
May 27, 2025 at 6:21 pm
kristan.sears
SubscriberFrom the software that I'm using, "A PSD is an Auto spectrum that has been "normalized" by dividing it by the frequency resolution of the Auto spectrum." In this case, it doesn't sound like the "frequency resolution" is the same as the variance of acceleration that you're referring to. The Auto Spectrum: "Each Auto spectrum is calculated by multiplying the DFT of a TWF by the complex conjugate of its DFT."
I could be misunderstanding these definitions, but it doesn't sound like the two PSDs are the same.
-
May 28, 2025 at 3:56 am
Dennis Chen
SubscriberCan you please share exactly what tool/code you used to generate the PSD curve?
-
May 28, 2025 at 11:58 am
kristan.sears
SubscriberIt's from ME'scope.
-
-
May 28, 2025 at 5:14 am
kuyaamee
SubscriberIf you’re looking to generate PSD (Power Spectral Density) curves for your input data, the easiest way is to use tools like MATLAB or Python with libraries like SciPy or Matplotlib. Basically, you take your time-domain signal, apply a Fast Fourier Transform (FFT), and then calculate the power over frequency. Using functions like
scipy.signal.welch()in Python makes the whole process pretty smooth. Just make sure your data is sampled properly and pre-processed to avoid noise skewing the results. Once you get the curve, you’ll be able to see which frequencies carry the most energy in your signal—super handy for everything from audio analysis to structural health monitoring! -
May 28, 2025 at 12:13 pm
Dennis Chen
Subscriberhttps://blog.endaq.com/vibration-analysis-fft-psd-and-spectrogram
This is a great reading material + resource + they have youtube videos that show you how to do this with real life clean signal if reading a ton isn't the way you like to learn. Not saying you should use what they have (they are commercial) but it's a great place to understand the logic so you can write your own code for your own purposes, which in my opinion is always way better than relying on third party tools for something like this because you are just processing data and there's a ton of examples out there.
lastly, I am not advocating this but I bet you can get chatGPT to write the code for you if you feed it the right signal. at least, it can give you a template to start from.
-
May 28, 2025 at 1:22 pm
kristan.sears
SubscriberThat's a great resource, and very helpful. I much prefer to read and learn on my own rather than having an AI bot spoonfeed me, so thank you very much for pointing me in the right direction. Once I get a bit more comfortable with it, I'll probably implement this conversion from the TWF to PSD on my own in Matlab.
Again, thanks for the tips. Very helpful.
-
-
- You must be logged in to reply to this topic.


-
3150
-
1013
-
945
-
858
-
797

© 2025 Copyright ANSYS, Inc. All rights reserved.


