We have an exciting announcement about badges coming in May 2025. Until then, we will temporarily stop issuing new badges for course completions and certifications. However, all completions will be recorded and fulfilled after May 2025.
General Mechanical

General Mechanical

Topics related to Mechanical Enterprise, Motion, Additive Print and more.

How to find the coefficient of thermal expansion from experimental curves

    • Jacopo Bardiani
      Subscriber

      Hi everyone,

      I'm doing a thermal analysis on a plastic cover. The datasheet of the producer of this material gives me the curves attached, that represent the thermal strain (deltaL / L_0) vs temperature, for the case alpha_P (parallel coefficient of thermal expansion) and alpha_N (normal coefficient of thermal expansion).

      I have two doubts about the graph:

      1) How can I obtain the curve to be inserted in ANSYS for what concerns the coefficient of thermal expansion (alpha vs T)? Each coordinate of the plot represents a thermal strain, so in which way I can pass from thermal strain to alpha?

      2) In the datasheet, which is the difference between the parallel coefficient of thermal expansion and the normal one?

      Thanks,

      Jacopo

    • peteroznewman
      Subscriber

      Use the definition for Secant Coefficient of Thermal Expansion found in this reference.

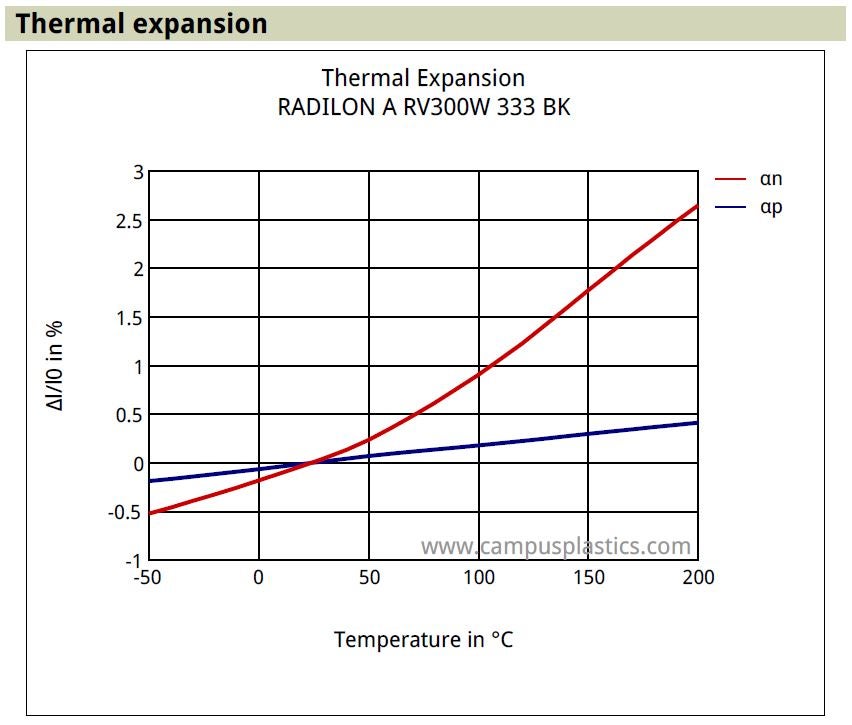
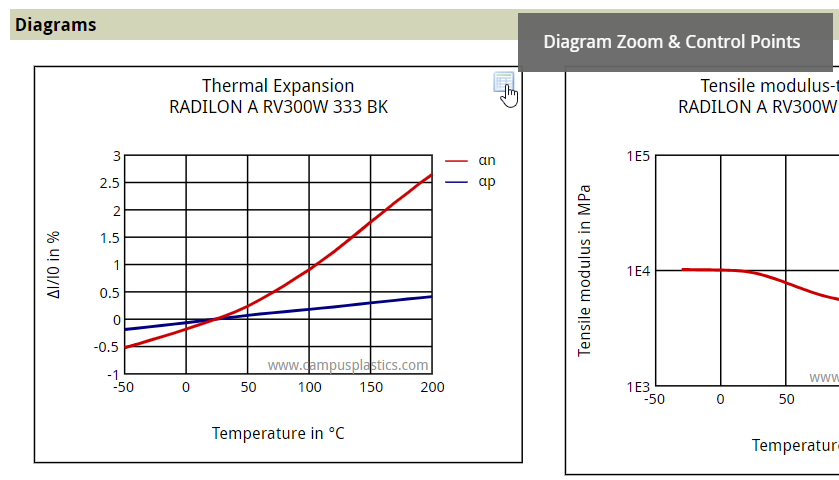
      On the Campusplastics website, click on the button on the top right of the plot to get to the Control Points and export the data into Excel.

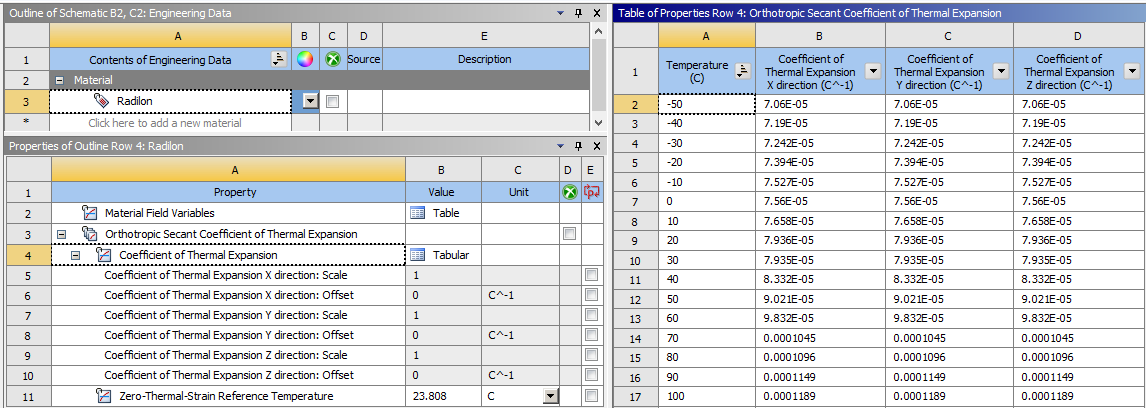
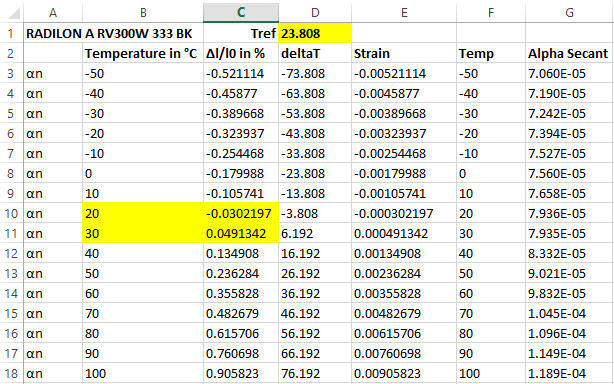
      Interpolate the coordinates in yellow to find the temperature for zero strain, which is the Reference Temperature, 23.808 C in this example. Create a column deltaT.  Create a column for Strain by dividing the Thermal Expansion in % by 100. Finally, the Secant Coefficient of Thermal Expansion is Strain/deltaT.  Insert a second column of Temp for ease of Copy/Paste columns F and G into Ansys.

      Repeat for the Parallel direction data.

      Most plastics are molded, so there is a flow direction, which is the parallel data, as in parallel to the flow while the normal data is orthogonal to the parallel direction. Let’s call the X axis the parallel direction, which means Y and Z will be the normal directions. You will need to create a local coordinate system to assign the material properties in the X direction that aligns with the flow.

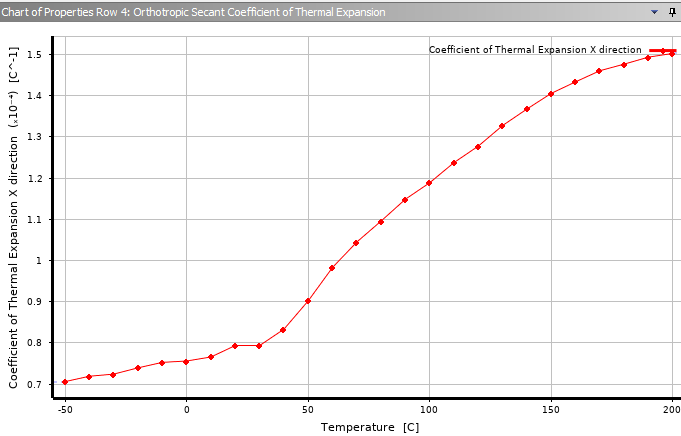
      In Engineering Data, insert an Orthotropic Secant Coefficient of Thermal Expansion. Copy paste the parallel data from columns F and G into the tabular data for the X direction and repeat using the normal data for the Y and Z directions. Note the Zero Thermal Strain Reference Temperature is entered as well.  In this screen shot, I just used the parallel data for Y and Z directions, but you will use the normal data for those columns.

    • Jacopo Bardiani
      Subscriber

      Hi Peter, thank you very much for the great explanation!

      Are you able to tell me you opinion on that (/forum/forums/topic/beam188-in-tension-with-a-creep-model-mth-in-adpl/)? I know you're really keen on that thematic!

      Thanks,

      Jacopo

Viewing 2 reply threads
  • The topic ‘How to find the coefficient of thermal expansion from experimental curves’ is closed to new replies.