TAGGED: metalens, metasurface, phase, RCWA, unit-cell
-
-
January 9, 2024 at 4:01 am
Nayem Hosen
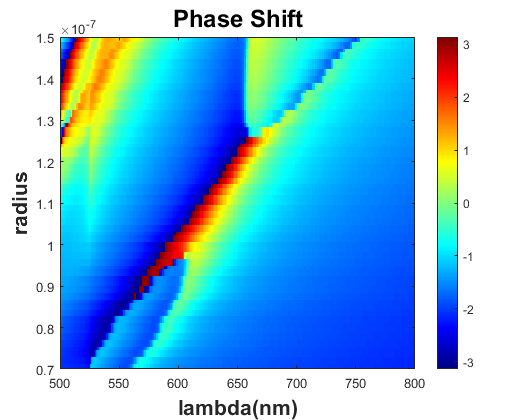
SubscriberI want to find out this figure using lumerical rcwa/fdtd.
But I am facing these problem when I use sweep parameters. Grating charaterization could not be concatenated.
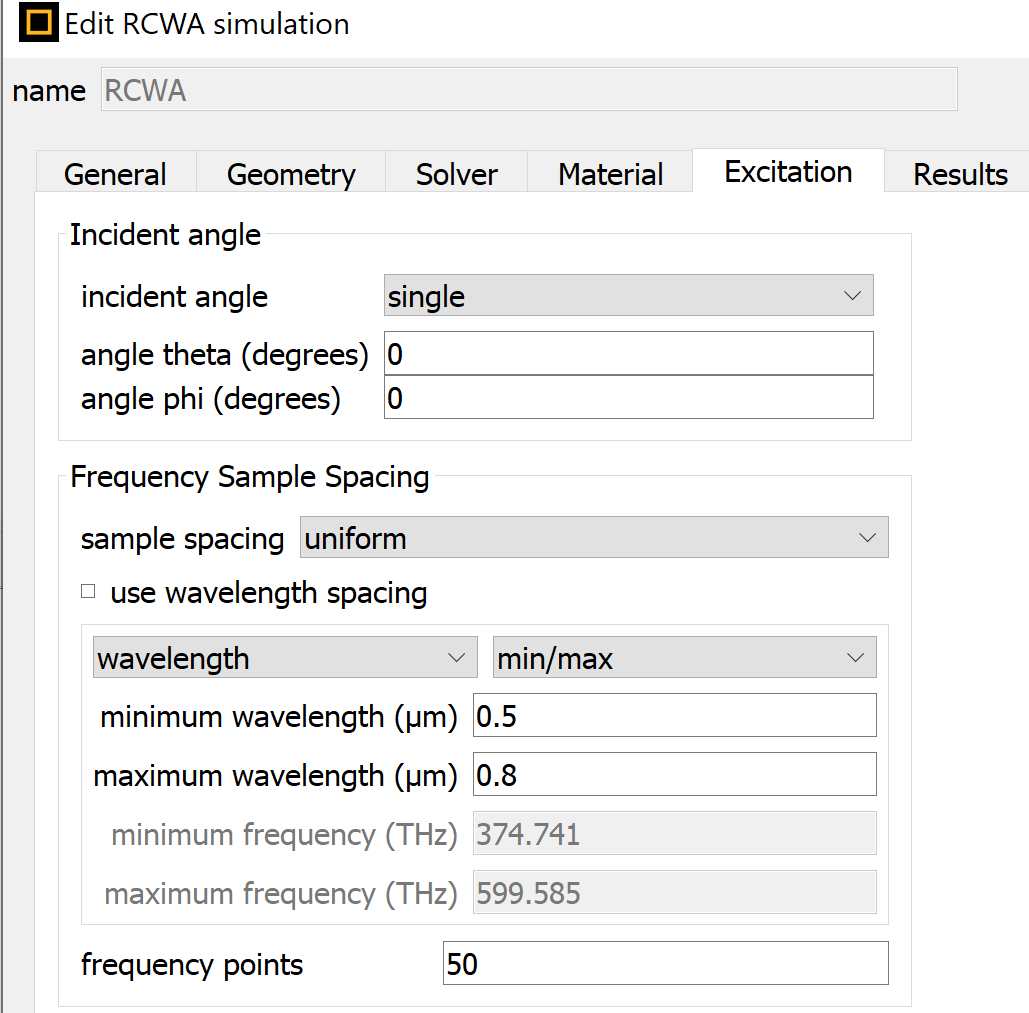
Here is my settings for rcwa simulation.
Please help me regarding this problem. Can I get phase shift figure directly from simulation or need to run script file?
-
January 10, 2024 at 10:08 am
Afroditi Petropoulou
Ansys EmployeeDear Nayem,
Since you are using RCWA, you don't need to add the wavelength to the sweep. It is better to have only the radius to the sweep and the wavelength can be set directly in RCWA settings as shown below:
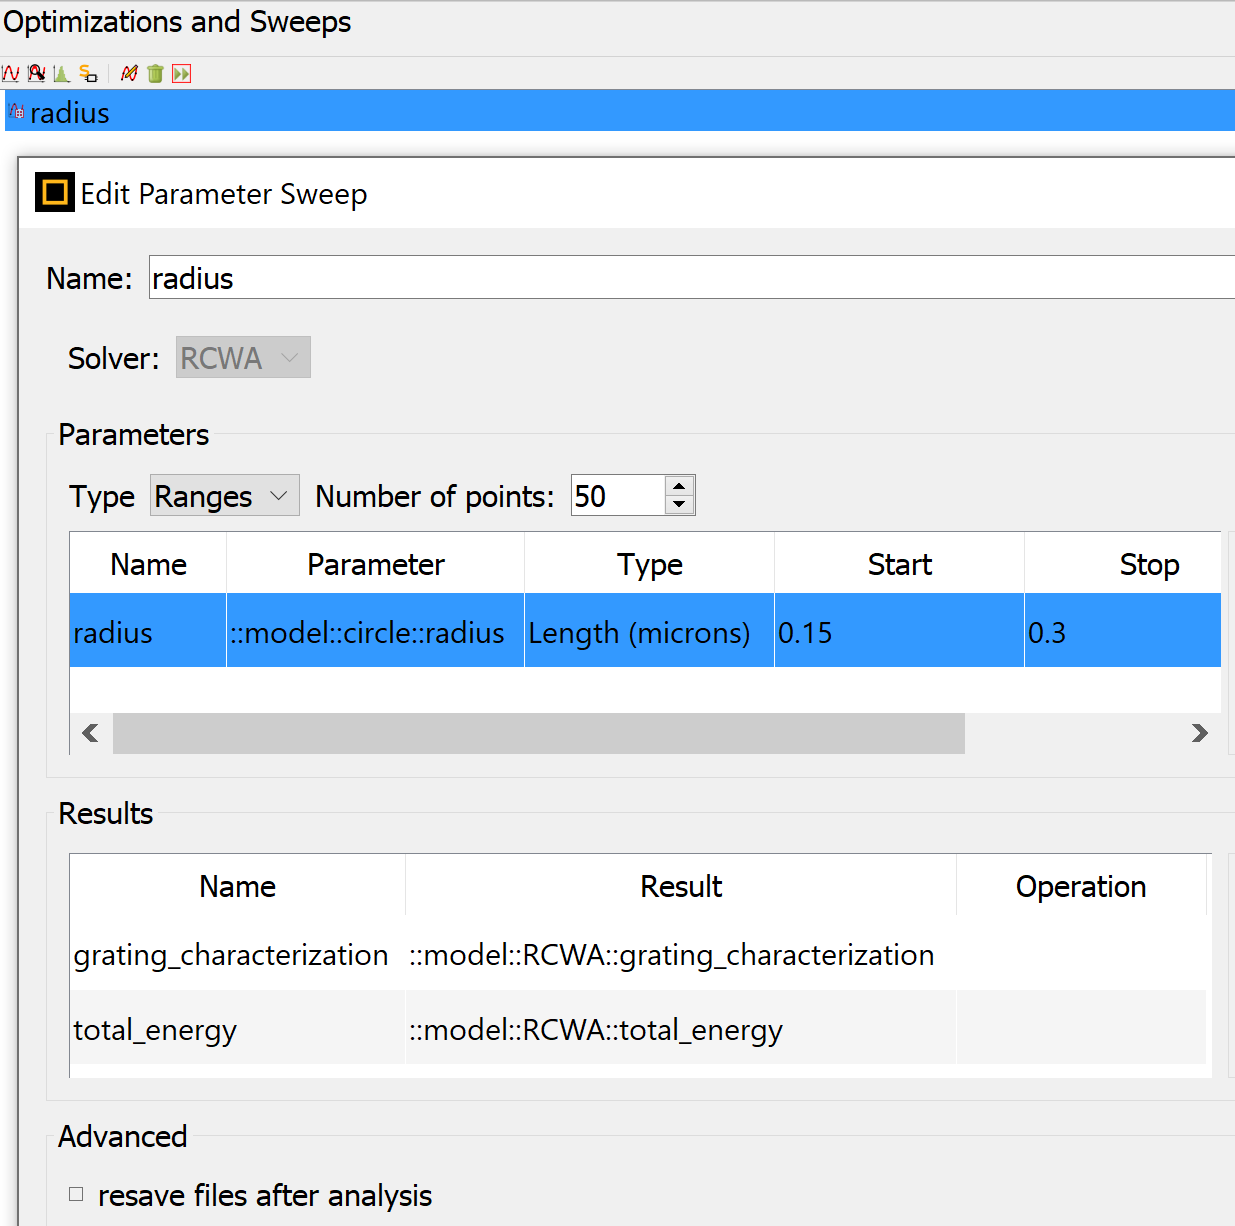
Then you add only the radius to the sweep:
Make sure to have enough frequency and radius points in order to be able to resolve the phase shift.
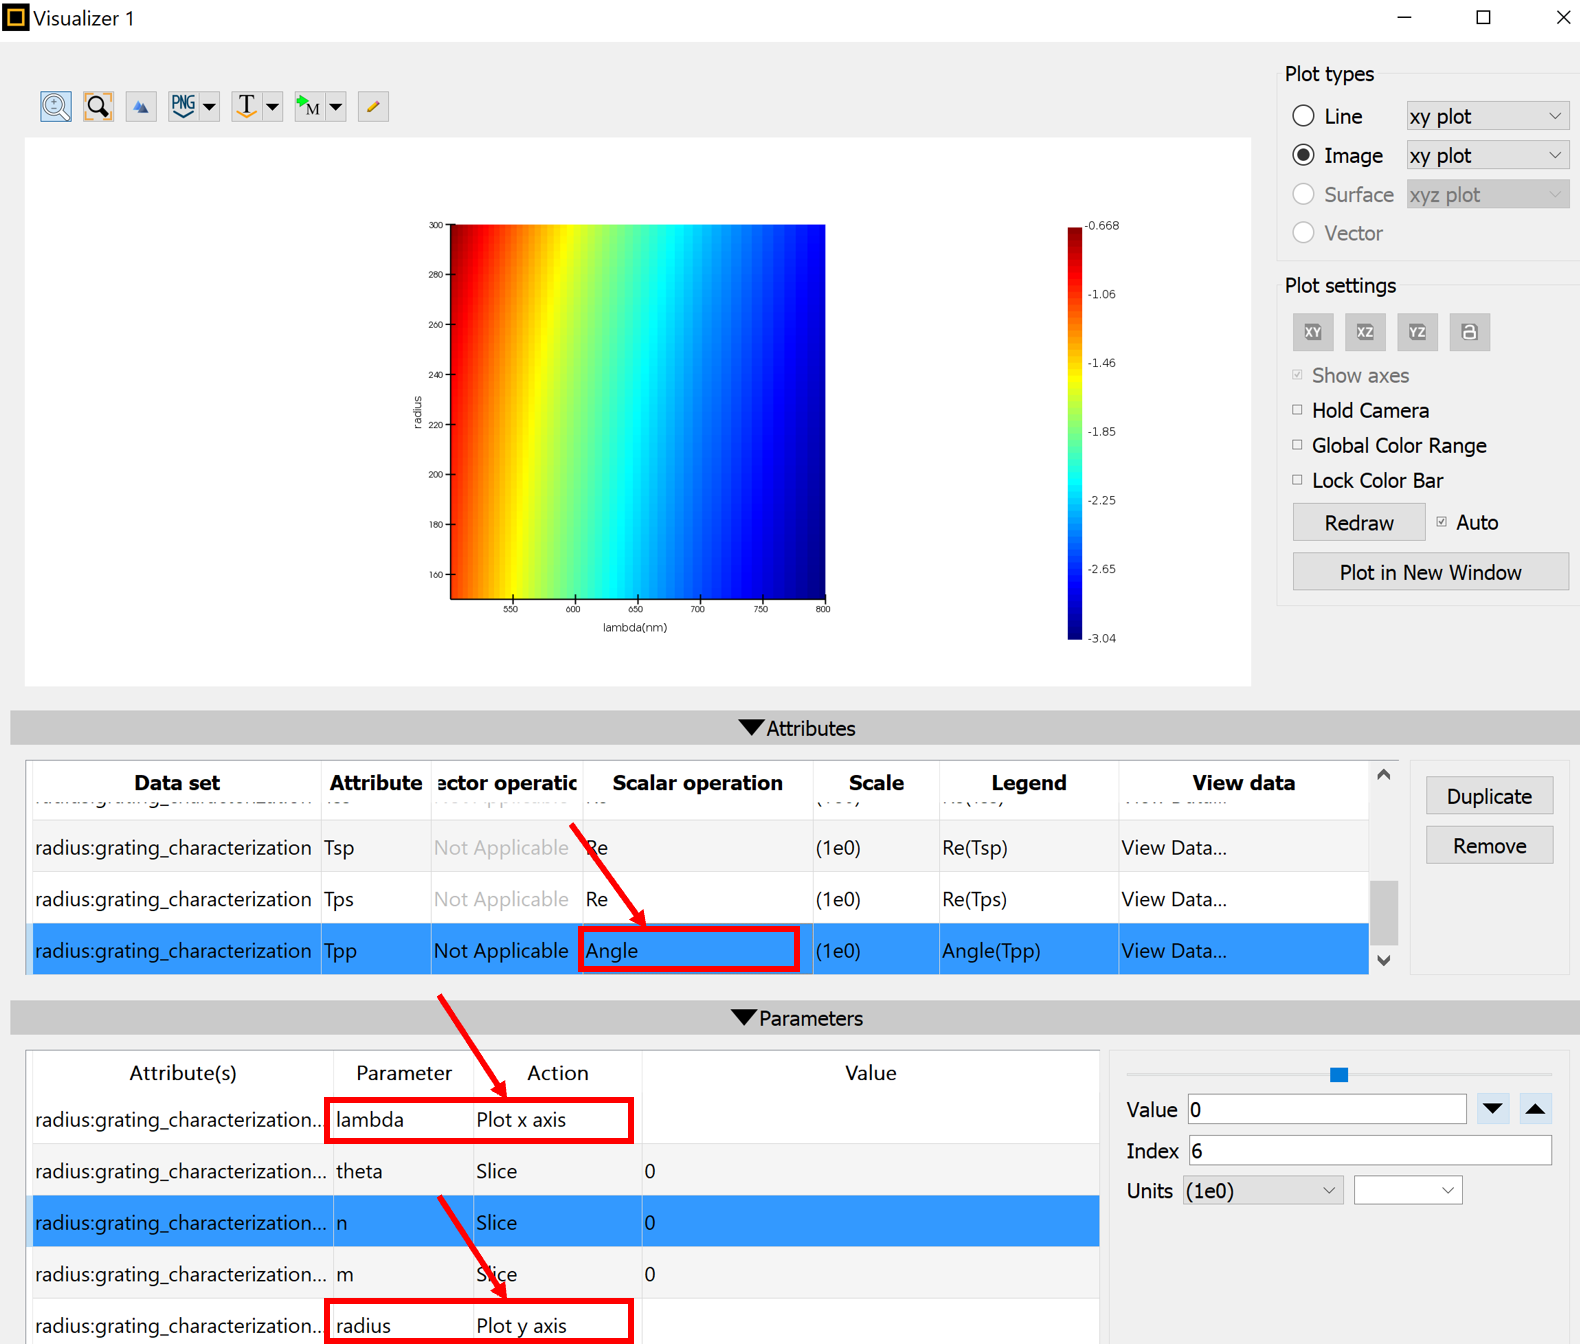
After running the sweep, you can directly get the phase plot by right-clicking on the radius sweep and visualize the grating_characterization result. In the visualization window, choose the result that you need (e.g. Tpp is shown below) and use "Angle" in the scalar operation option. In the parameters, choose to plot lambda as x axis and radius as y axis. For n and m choose the value that you are interested in (0 for 0th diffraction order is shown below):
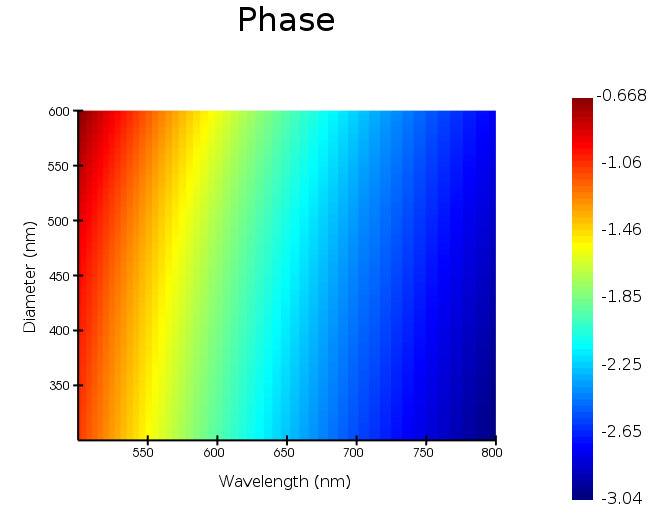
Alternatively, you can use the following script to get the phase plot (this takes into account p polarization (Tpp) but you can do the same for s polarization too):
grating_characterization = getsweepresult("radius","grating_characterization");
total_energy = getsweepresult("radius","total_energy");
radius = grating_characterization.radius;
lambda= grating_characterization.lambda;
ni = find(grating_characterization.n, 0);
mi = find(grating_characterization.m, 0);
S = pinch(grating_characterization.Tpp(:,1,ni,mi,:));
T = abs(S)^2;
phase = angle(S);
image(lambda*1e9,2*radius*1e9,phase,"Wavelength (nm)","Diameter (nm)","Phase");
The above script will give you the plot shown below:I hope this helps.
Best Regards,
Afroditi
-
January 10, 2024 at 9:07 pm
Nayem Hosen
SubscriberThank you for your help. Really appreciate.
Could you please help me with one more thing?
I do the same as you suggest and got the phase result (note that for s and p polarization got the same result). See below-
Here is the screenshot of the paper which I need to figure out.
The problem is that I didn't got the same phase result as the paper (see screenshot fig.d.). But I got the same result of transmittance as fig.f using my above rcwa simulation. That means my simulation is correct I think. Why I can't get the same phase result, can you have any idea?
-
January 11, 2024 at 9:47 am
Afroditi Petropoulou
Ansys EmployeeDear Nayem,
What you plot is the phase. The paper plots the phase shift. As you can see, the calculated phase has a range between -3.14 and 3.14, while the phase shift plotted in the paper has a range between 0 and 2. Is there a refernce phase discussed in the papaer? What does a phase shift means in the paper you mention?
If there is a reference phase then you need to subtract it from the one you caclulated.
Best Regards,
Afroditi
-
January 12, 2024 at 5:05 am
-
January 12, 2024 at 11:43 am
Afroditi Petropoulou
Ansys EmployeeDear Nayem,
It is not clear to me what exactly is plotted in the paper.
As stated though in Figure 2, the units are in pi. Hence, you need to devide your result by pi. To get the result from 0 to 2 though, you also need to subtract something from the calculated phase. It can be either 3.14 or a reference phase (probably a phase without the nanodisk?).
Furthermore, you need to use the same structure. Is the whole nanodisk embedded in 1.5 whithout having a substrate? Does it also have a substrate? Are the materials used exactly the same? All the above can influence the result.
The only thing that could influence the accuracy of the RCWA solver is the number of k vectors used which can be found in the "Solver" tab of RCWA. Increasing this number will increase the accuracy in the expense of higher simulation time. Probably 100 k vectors (for circular k vectors domain) are sufficient but you can run a convergence test by gradually increasing this number to check if the results remain the same.
You can also use FDTD to run it, but it will require more time and you also need to be careful with the boundary conditions, especially the PML that will be used at the bottom and top of the simulation region. If PMLs don't absorb the fields properly, the results might not be correct. Hence, one needs to be careful with the PML settings in this case.
Best Regards,
Afroditi
-
January 19, 2024 at 3:26 am
-
-
- The topic ‘How to find out Phase shift of transmitted wave varying radius vs wavelength’ is closed to new replies.


-
4838
-
1587
-
1386
-
1242
-
1021

© 2026 Copyright ANSYS, Inc. All rights reserved.

