TAGGED: metasurface, mie-theory, phase-change, scattering-matrix
-
-
March 22, 2024 at 2:44 pm
100521665
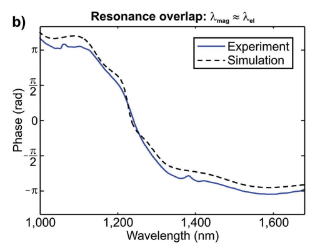
SubscriberI wanted to reproduce the phase figures from Decker et al. (Adv. Optical Mat., 2015) article:
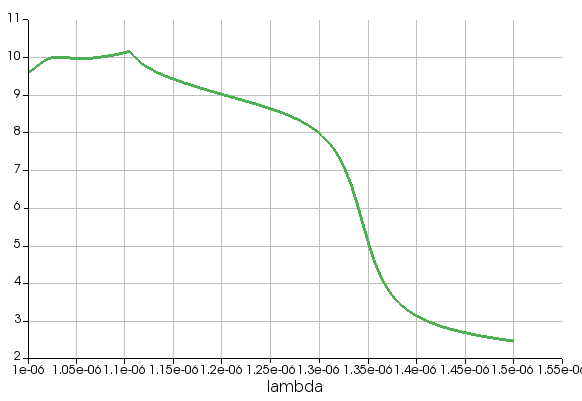
I was given something similar by using the 's_grating_components' script, present in this model:
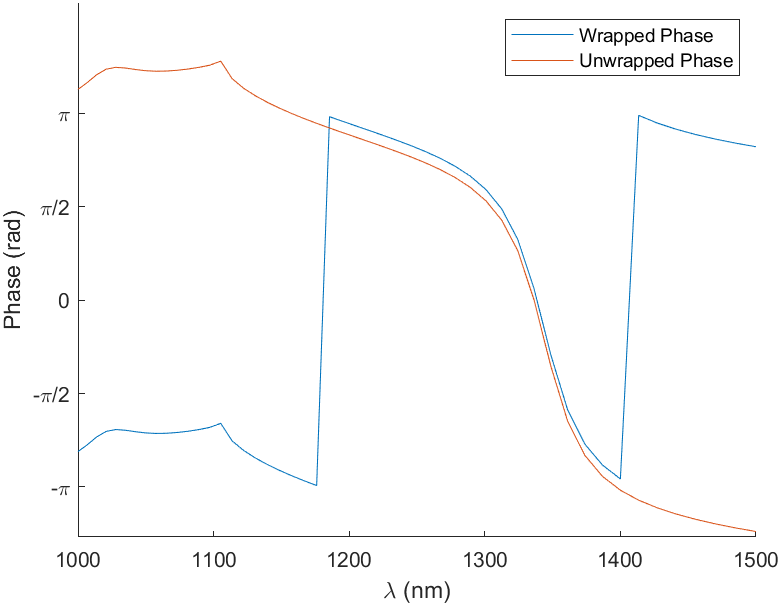
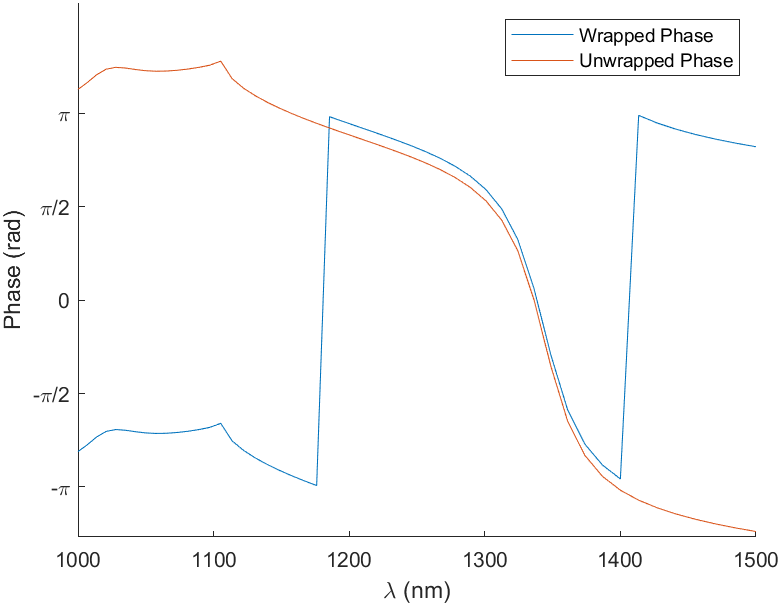
With this one being the unwrapped graph. Using f() = angle() I get this graph, which is the 'wrapped' version:
My intention was to accommodate the upper graph to the range of the latter (so I can have a realistic phase characteristic with [pi,-pi] limits). To do so, I was suggested to use an approximation basing myself over the 'center frequency'. I guessed to use this own-made MATLAB script:
Where the term 'pi/2' serves as a y-axis correction. It depends on where is your final graph located at. Using it, I have been able to plot something like this:
Which is somehow better, but still gets outside the real phase limits, and that is something I cannot tolerate because it lacks physical meaning. Is this script correct? Can Lumerical implement it without getting out of it?
Besides this, using this simulation I find a shift in phase (you can see this as in the reference picture the middle-point of the phase gets at 1200 nm, meanwhile in my case I find this point at 1300 nm), which I don't see why happens as my model is identical to that of the article.
Hope you can answer both questions. Appreciate your help.
-
March 22, 2024 at 4:51 pm
Guilin Sun
Ansys EmployeeI believe the result is correct with your simulation settings. Phase is very sensitive to mesh accuracy (and PML reflection). you may need to refine the mesh with proper total PML thickness say half wavelength (number of PML layers times the mesh size in front of PML).
Duplicating other's work is very challenge, since the pulication does not give full details of their material data (even though they say it is a specific material, say Si), and mesh size. Please refer to this post:
Ansys Insight: Why my simulation result is different from published paper or experiment?
As can be seen from the the above plots, your simulation result differs from the publication not only in magnitude, but also the shape of the curve. There must be something that differs yours from publication.
-
March 22, 2024 at 5:28 pm
100521665
SubscriberWhat about the calculus for the phase? Do you think I can wrap/unwrap following that basis?
-
-
March 22, 2024 at 6:32 pm
-
March 22, 2024 at 6:46 pm
100521665
SubscriberIf it is wrong, what should I do to fix it? Is anything shown at the MATLAB's script wrong? Should I re-apply another correction? Any suggestion would be appreciated.
-
March 22, 2024 at 7:00 pm
Guilin Sun
Ansys EmployeeNo, I did not say your is wrong. I just say that for your simulation file, the phase is larger than pi. This is why I gave you the post link for any possible reasons :Ansys Insight: Why my simulation result is different from published paper or experiment?
I have suggested to use finer mesh for further testing. If the material data or fitting is different, then it is hard to say what causes the difference. Please refer to the above post to check carefully which parameter is different from the publication.
-
- The topic ‘How to do ‘Phase Wrapping’?’ is closed to new replies.


-
4904
-
1588
-
1386
-
1242
-
1021

© 2026 Copyright ANSYS, Inc. All rights reserved.


