TAGGED: apdl, displacement-load, graph
-
-
March 17, 2024 at 4:09 am
Farjaad Salam
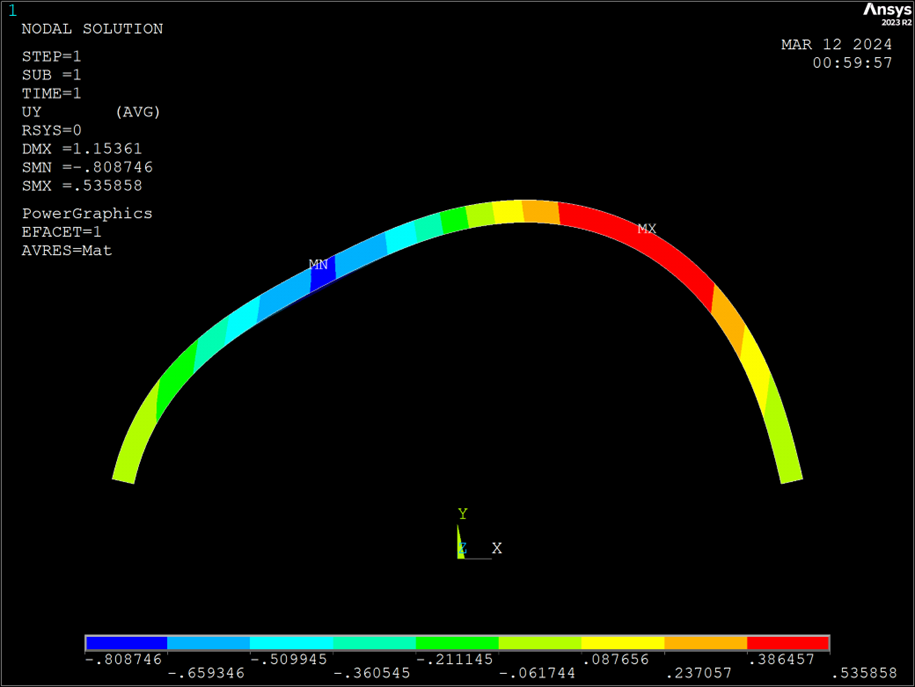
SubscriberI solid-modelled a masonry arch barrel with a radius of 750mm, width of 450mm, thickness of 50mm and angle of embrace of 154 degrees. I then mesh tooled to an element size of 25 mm and added a load downwards of 5000N as a knife edge point load at a node in the quarter region (node 1574 in my case). both abutments were fixed in all directions and gravity was added. I'm using solid185, EX is 5000, and PRXY is 0.2. Despite all this, I'm only getting a displacement of around 1mm which seems wrong. I'm only interested in the loading place displacement in the y direction and trying to compare it to another work. I need it in increments of 500N until failure (5000N should fail) and the force displacement is all graphed. I'll include a few relevant screenshots
-
March 20, 2024 at 2:04 pm
dlooman
Ansys EmployeeIf you used an arbitrary load step time of 1.0 we know the force will be 5000 N. times time. Here is a way to make a force deflection plot in post26. Use the /axlab command to create axes descriptions.
/post26
nsol,2,1574,uy ! Displacement
xvar,2 ! Make Displacement the x axis
prod,3,1,,, ,,,5000 ! Variable 3 is time (variable 1 by default) times 5000
plvar,3 ! Plot force vs displacement
-
- The topic ‘How to create a force displacement graph on APDL for an arch in static analysis?’ is closed to new replies.


-
4607
-
1510
-
1386
-
1209
-
1021

© 2025 Copyright ANSYS, Inc. All rights reserved.


