We’re updating our badges platform. Badge issuance is temporarily paused, but all completions are being recorded and will be fulfilled once the platform is live. Thank you for your patience.
General Mechanical

General Mechanical

Topics related to Mechanical Enterprise, Motion, Additive Print and more.

How to Change Time-Acc graph to the Freq-Acc graph?

    • YJ L
      Subscriber

      i want to compare the results with transient analysis and response spectrum. the picture says to use RESP Command, but i don't know exactly which command and how to use them. How do i write the RESP command to convert 20g acceleration- time 5ms data into frequency-acceleration data?

      (this picture is my data)

    • mrife
      Ansys Employee

      Hi YJ

      That RESP command is an Mechanical APDL command.  It is not a WB Mechanical function/feature.  You can look up that command in the Ansys MAPDL Help - there is an example on using it though it assumes that a time transient analysis has been done and uses the displacement time history of a node as the input.

      There is a LF post on using this though it looks like the format got messed up somehow; there are "n" instead of new line character so it's all one big paragraph!  Here is the link to that:

      /forum/forums/topic/how-to-create-a-shock-response-spectrum-from-time-history-data-with-apdl-commands/

      Mike

    • peteroznewman
      Subscriber

      Hello YJ L,

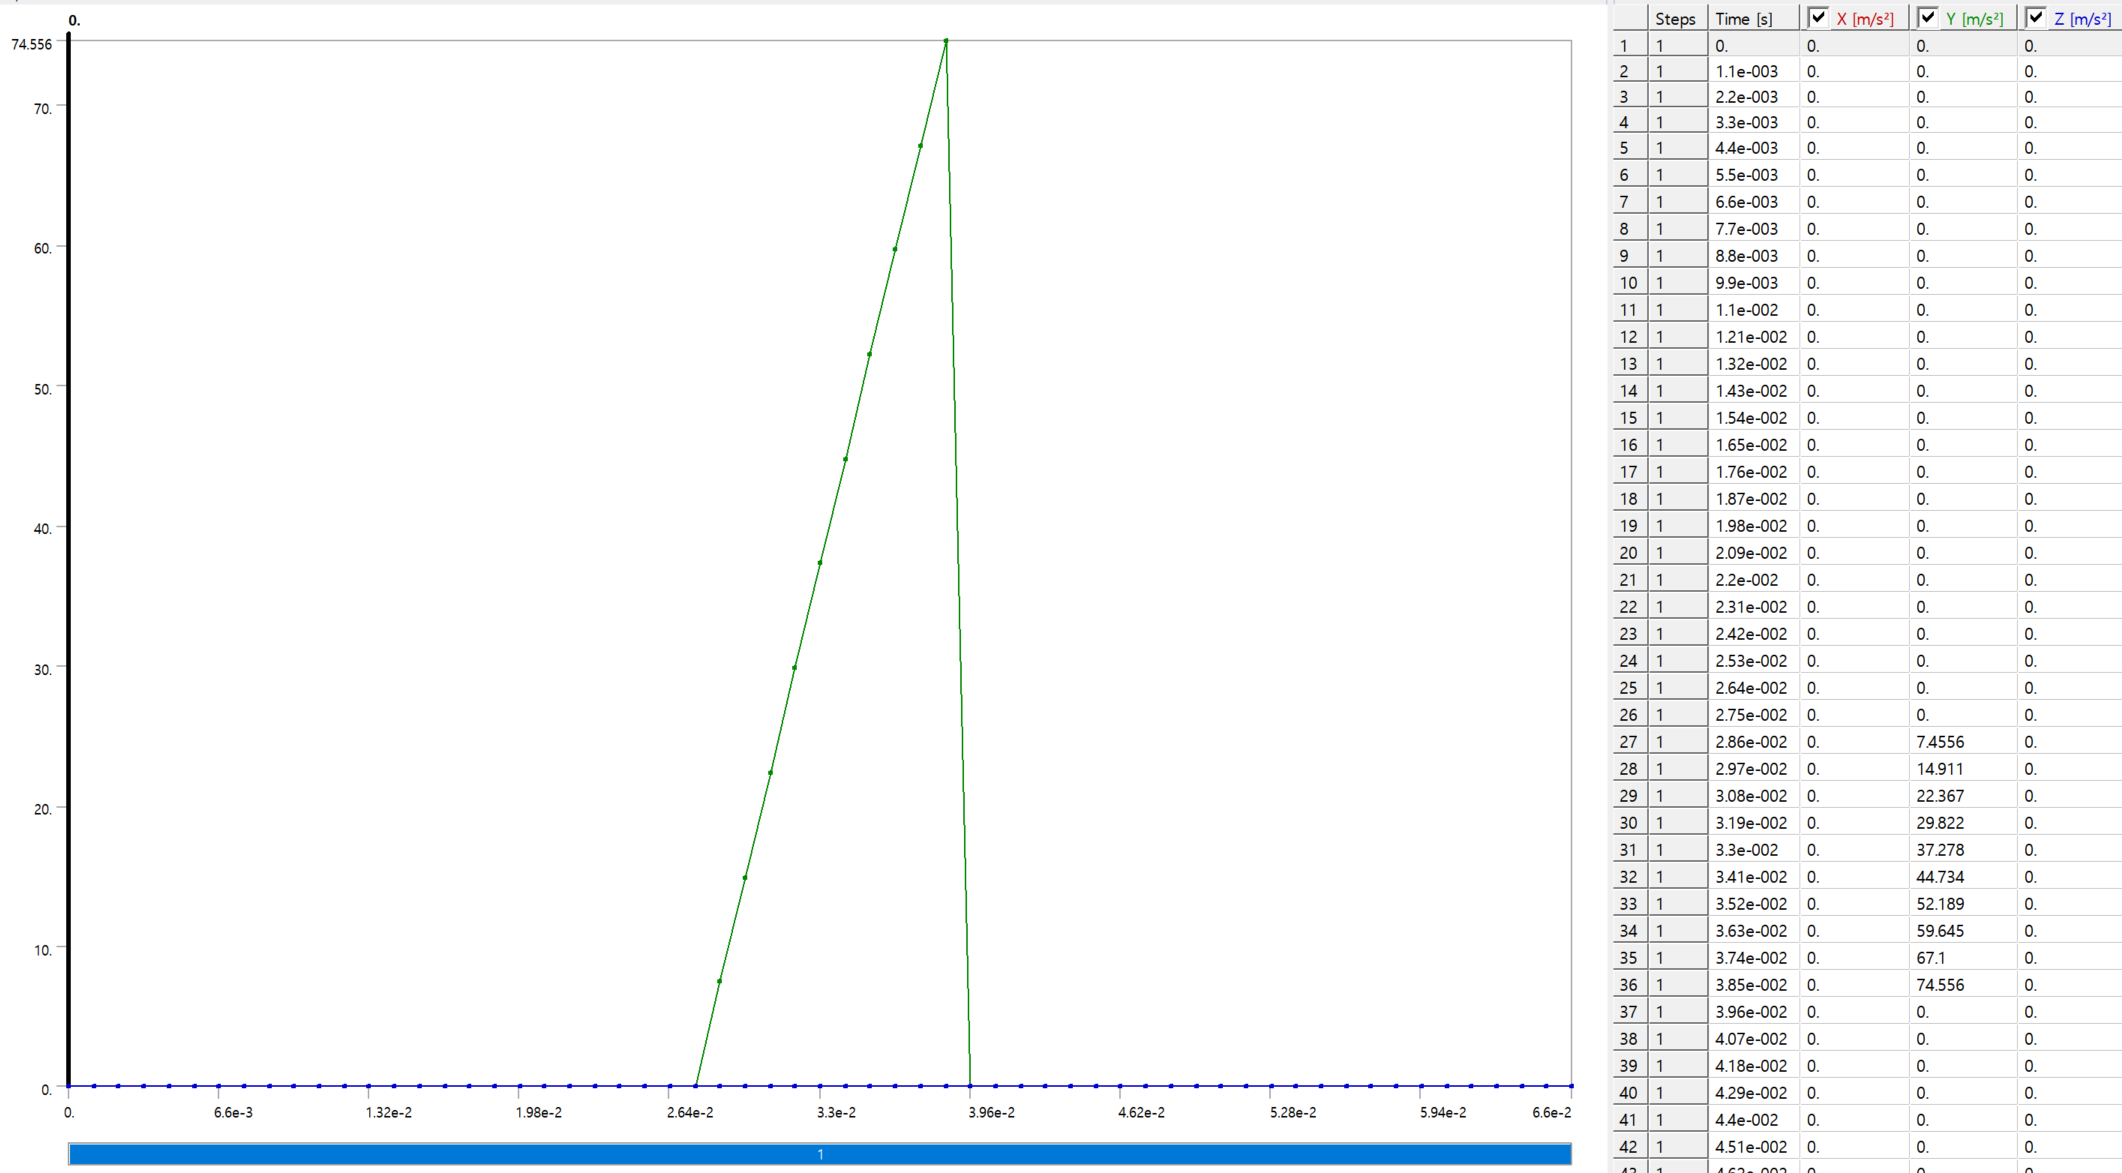
      You said you want to convert a 20 g amplitude, 5 ms duration signal into a Response input spectrum, but when I look at the plot of your data, the triagular pulse has a magnitude of 74.556 m/s^2 (7.6 g) and a duration of 0.0121 s.  So which is it?

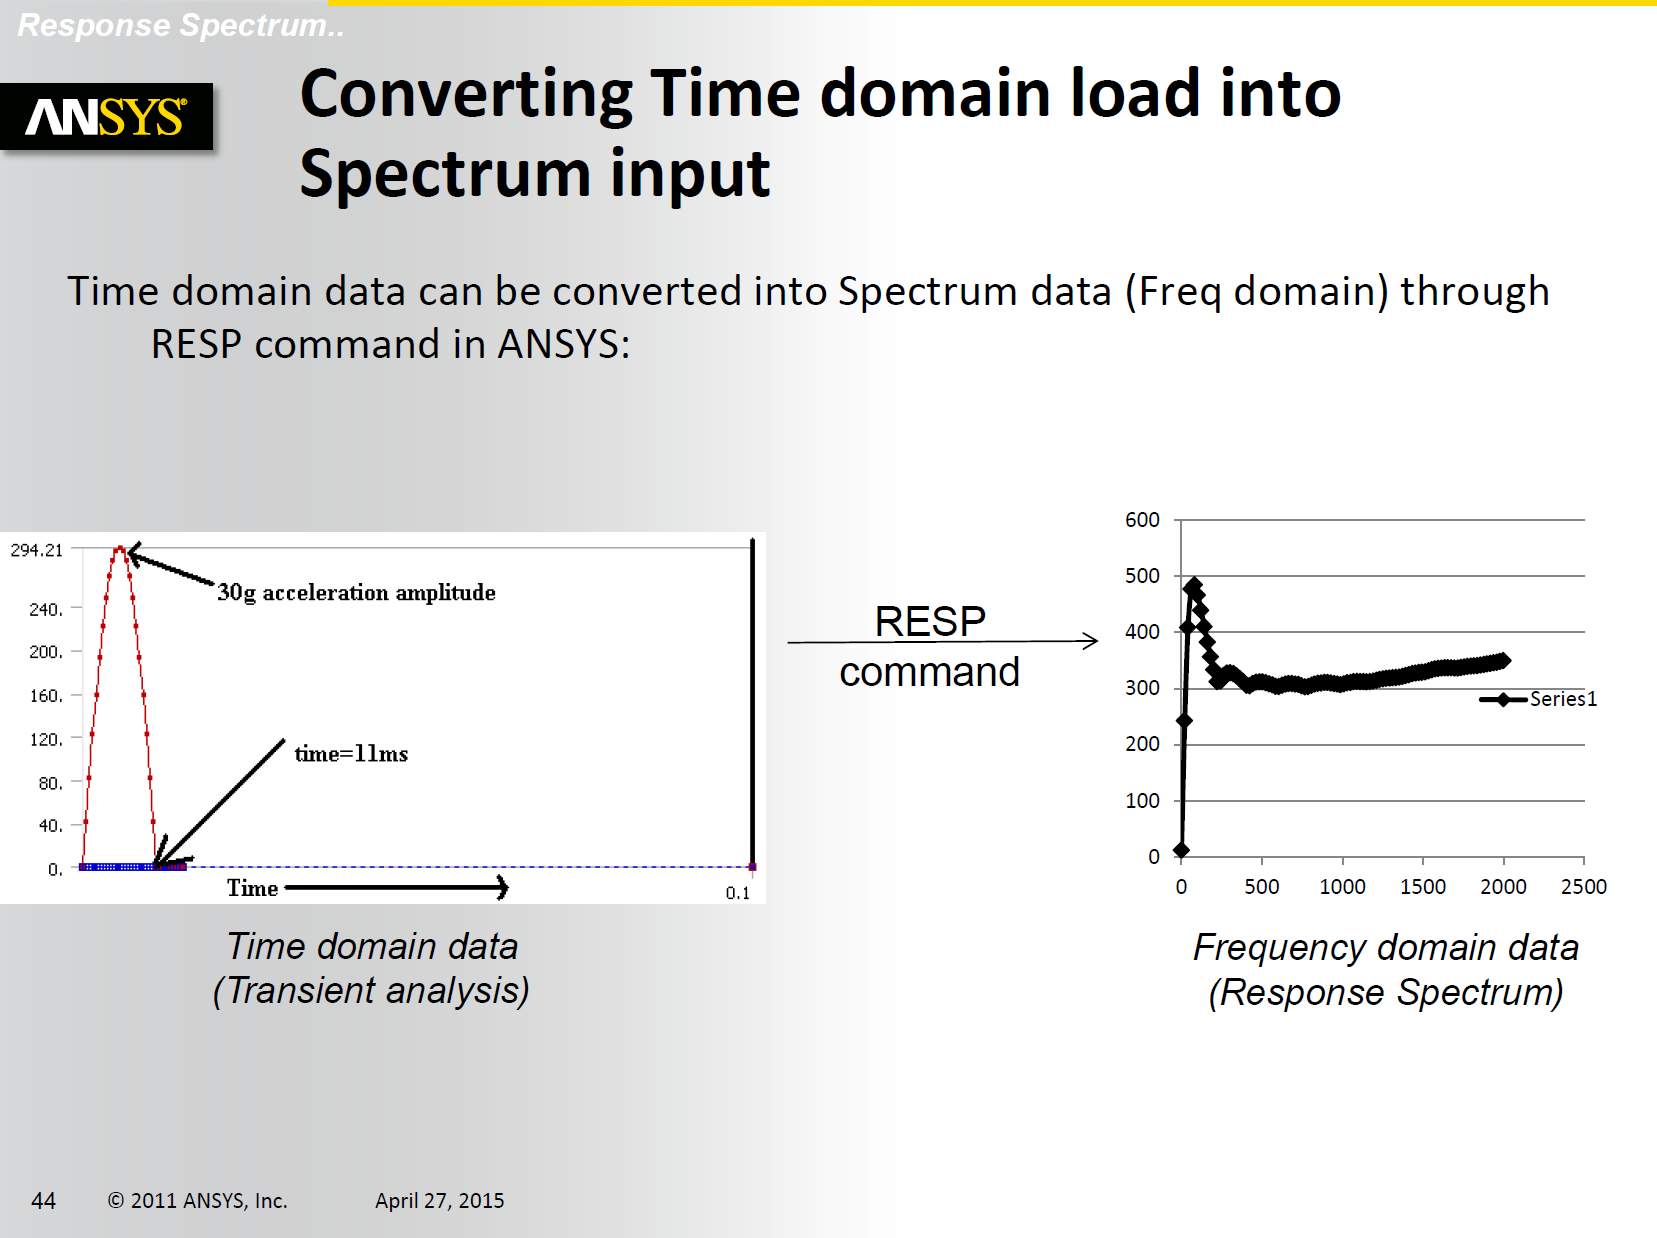
      Software tools outside of Ansys are available to convert a time-history into a Shock Response Spectrum. I use the free, Stand-Alone Executable Version of Vibrationdata because it doesn’t require a copy of matlab to be installed.  If you have matlab installed, there is a larger toolkit that is also free. Look for the relevant links on this page: https://vibrationdata.wordpress.com/

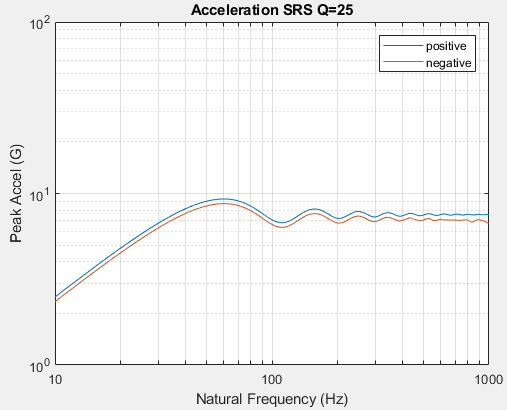
      Conversion of time-history data requires you to choose the Q factor that defines the damping in your structure.  If you know the critical damping ratio for your structure, Zeta, then Q = 1/(2Zeta). For example, if your structure has a critical damping ratio of 2%, then Q = 25.  You add damping to the excitation because the Modal analysis provides undamped modes. What is the Q factor for your structure?

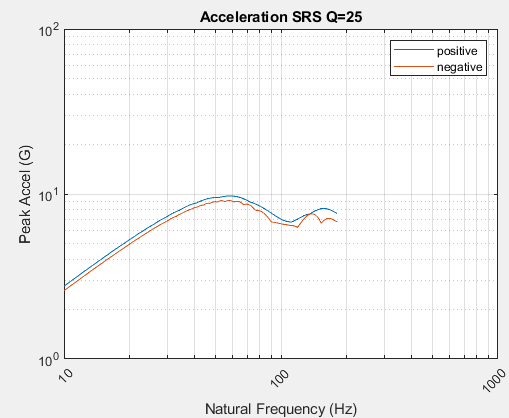
      What is the frequency range you want to study for your structure?  I suspect the sampling frequency used in the representation of this triangular pulse is too low as it is only 909 Hz (sampling delta t = 0.0011 s).

      By sampling the triangular pulse at 10,000 Hz, the Shock Response Spectrum can be calculated above 1000 Hz.

Viewing 2 reply threads
  • The topic ‘How to Change Time-Acc graph to the Freq-Acc graph?’ is closed to new replies.