

-
-
August 28, 2021 at 12:25 am
xing
SubscriberAugust 30, 2021 at 1:24 pmKarthik Remella
AdministratorHello If this is a 2D problem, could you not use the y-velocity on that boundary?
Karthik
August 30, 2021 at 5:40 pmDrAmine
Ansys EmployeeExpression : density×velocity vector×face area vector
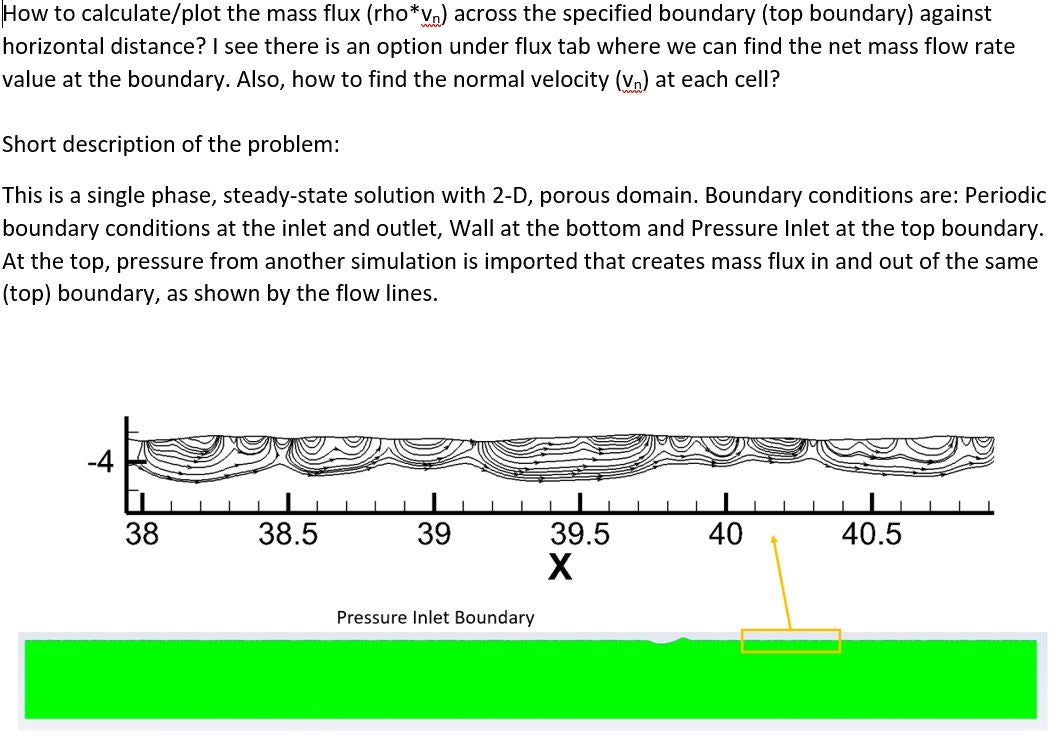
August 30, 2021 at 11:12 pmSubscriberYes, it is a 2D problem, but the surface where we want to plot the normal velocity is not a perfectly straight line as you can see in the image. Therefore, y-velocity would not be a normal velocity. The non-straight surface is making the flux go inside and out of the top (Pressure inlet) boundary as seen in the flow lines. Also, we have a curved boundary near the center where we also need the normal velocity.
Also please let us know how to plot mass flux across the same boundary.The mass flux = rho*v_n (v_n: normal velocity). We want to plot this normal velocity at the top boundary.
August 31, 2021 at 9:51 amAnsys EmployeeYou can create a custom vector with the mass flux expression. You can create a custom field function or Expression with rho*v_n and use it as additional variable for plotting, contour plots, etc..
September 1, 2021 at 10:31 pmSubscriber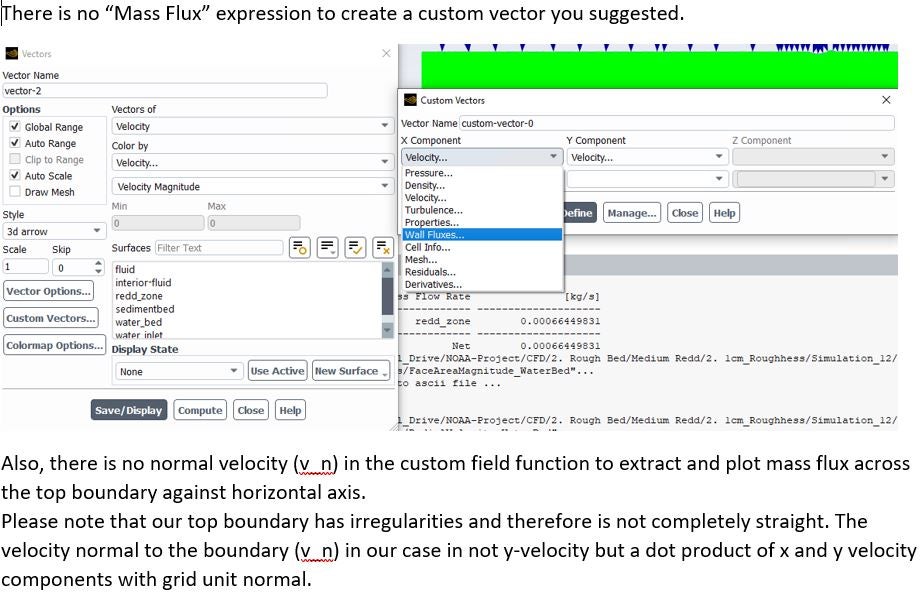
September 2, 2021 at 7:44 amAnsys EmployeeYou can create your own Custom Field Function or Expression with that formula to get mass flux calculated and use that either as contour plot or to create a vector.
September 3, 2021 at 9:32 pmSubscriberHow to get x and y-components of "grid unit normal vectors" so that we can use in the formula to find normal velocity?
Once you find new function using "Custom field Function Calculator", how to display in contours and vectors? I did not find this new function appear on vectors and contours.
September 6, 2021 at 11:08 amRob
Forum ModeratorCustom Field Functions can be displayed once they're created: look in the Fluent Post-processing. If you're looking for the velocity normal to a boundary (as opposed to x, y or z component) you may need to do a little trigonometry.
September 29, 2021 at 9:57 pmSubscriber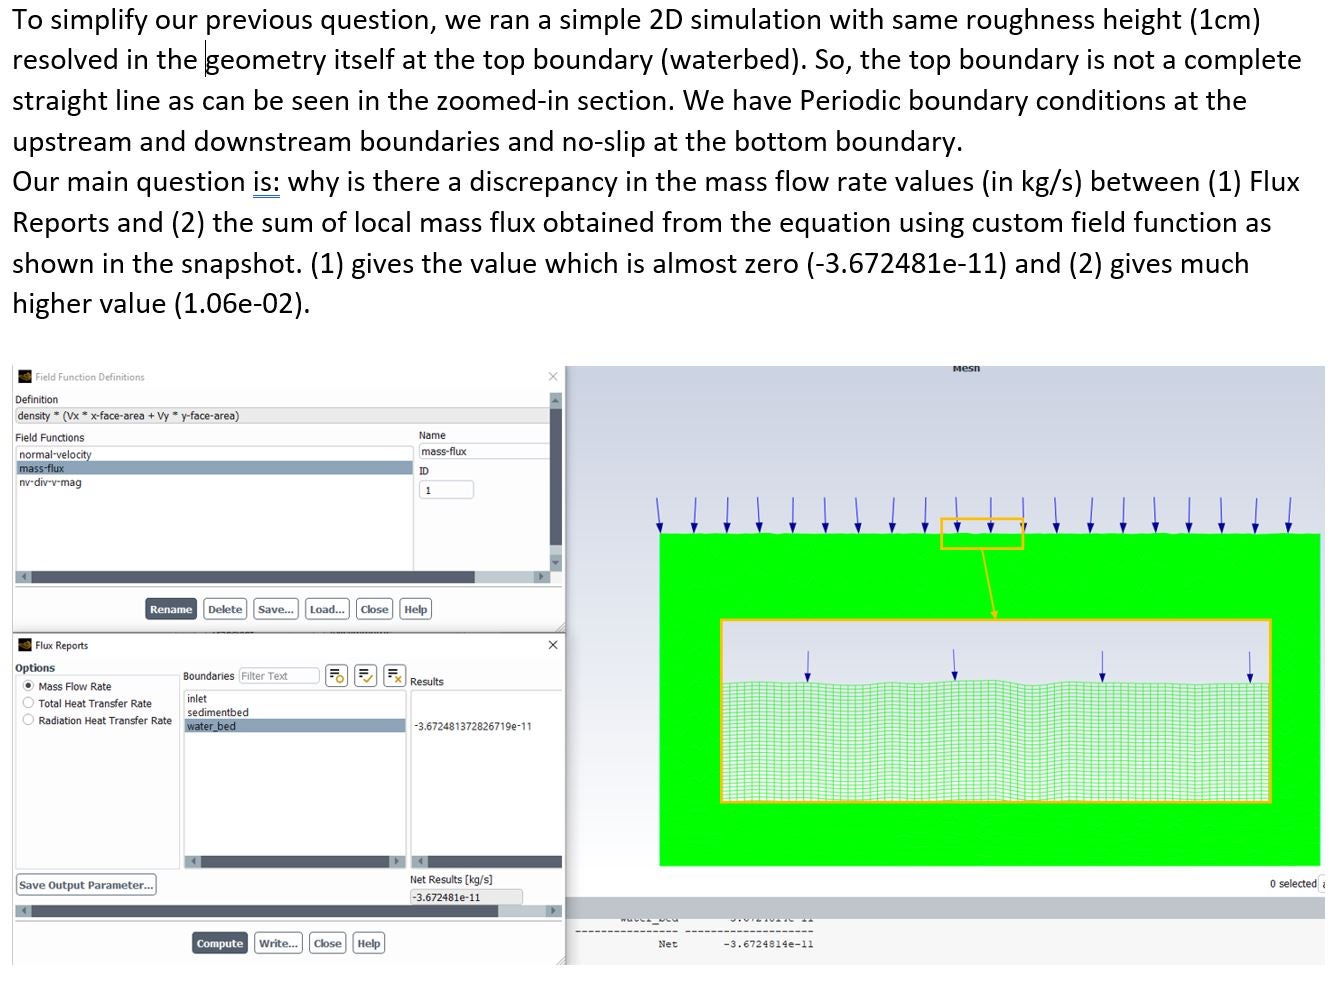
September 30, 2021 at 1:44 pmForum ModeratorCan you post an image showing exactly where the boundaries are? If you have a periodic flow, how can you also have an inlet but no outlet?
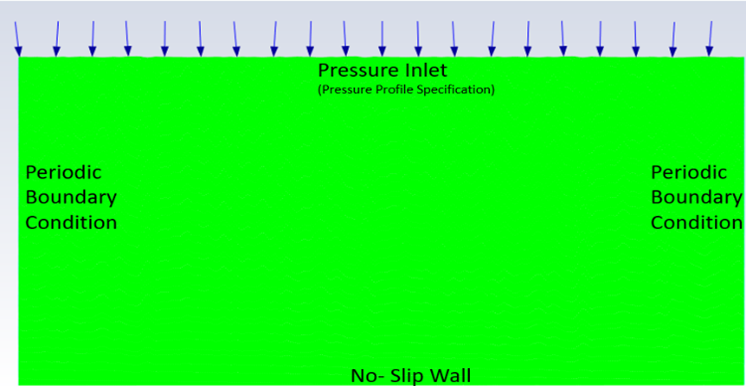
September 30, 2021 at 6:28 pmSubscriberBob: We applied pressure inlet on the top boundary, periodic boundary conditions on the left and right boundary, and then no-slip wall on the bottom boundary, as shown below. Note that, pressure inlet also allows the flow to go out of the domain and the same for the periodic boundary on the right. Our question was on the discrepancy between the mass flow rates calculated using two approaches. To save time, could you please have a zoom meeting with my Ph.D. student Bishal (bhat7152@vandals.uidaho.edu)?
October 1, 2021 at 12:17 pmForum ModeratorCan you alter the model to meet the requirements https://ansyshelp.ansys.com/account/Secured?returnurl=/Views/Secured/corp/v212/en/flu_ug/flu_ug_sec_periodic_overview.html for periodic boundaries and repeat the calculation?
Viewing 12 reply threads- The topic ‘How to calculate/plot the mass flux across a boundary in FLUENT?’ is closed to new replies.
Innovation Space Trending discussions
 Top Contributors
-
peteroznewman
 5654
5654 -
scabo
 1890
1890 -
Dennis Chen
 1414
1414 -
javat33489
 1303
1303 -
Shyam Prasad V Atri
1021
Top Rated Tags
© 2026 Copyright ANSYS, Inc. All rights reserved.
Ansys does not support the usage of unauthorized Ansys software. Please visit www.ansys.com to obtain an official distribution.
-


The Ansys Learning Forum is a public forum. You are prohibited from providing (i) information that is confidential to You, your employer, or any third party, (ii) Personal Data or individually identifiable health information, (iii) any information that is U.S. Government Classified, Controlled Unclassified Information, International Traffic in Arms Regulators (ITAR) or Export Administration Regulators (EAR) controlled or otherwise have been determined by the United States Government or by a foreign government to require protection against unauthorized disclosure for reasons of national security, or (iv) topics or information restricted by the People's Republic of China data protection and privacy laws.
