TAGGED: ansys-fluent, ansys-student, cfd-post, fluid-dynamics, fluid-flow
-
-
August 17, 2021 at 4:22 am
Anadi_Mondal
SubscriberHello,
I want to average local values(ex. deposition mass flux) along the circumference of a pipe at each axial position and finally plot the average values at the end of the simulation.
Would you give me an idea of how can I do this?
Regards,
Anadi
August 17, 2021 at 2:48 pmRK
Ansys EmployeeHello,
You can setup a area weighted average report definition.
https://ansyshelp.ansys.com/account/secured?returnurl=/Views/Secured/corp/v202/en/flu_ug/flu_ug_sec_report_definition_creation.html?q=report%20definition
August 17, 2021 at 11:18 pmAnadi_Mondal
Subscriber
Thank you for your reply.
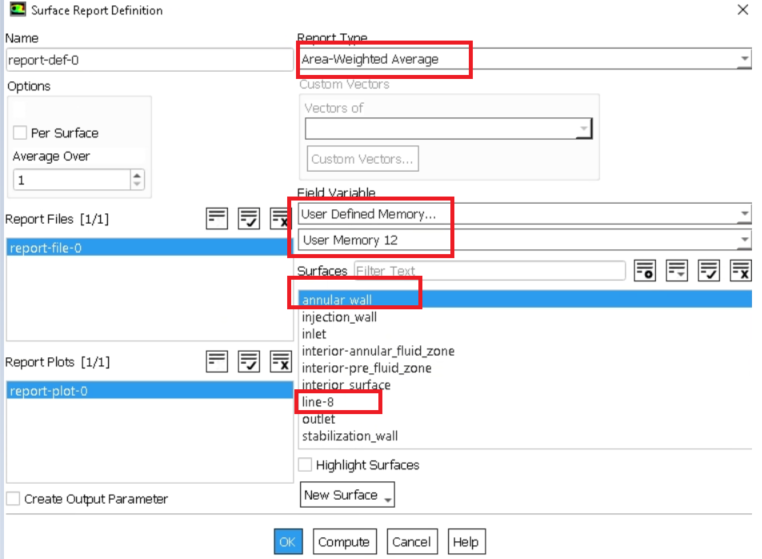
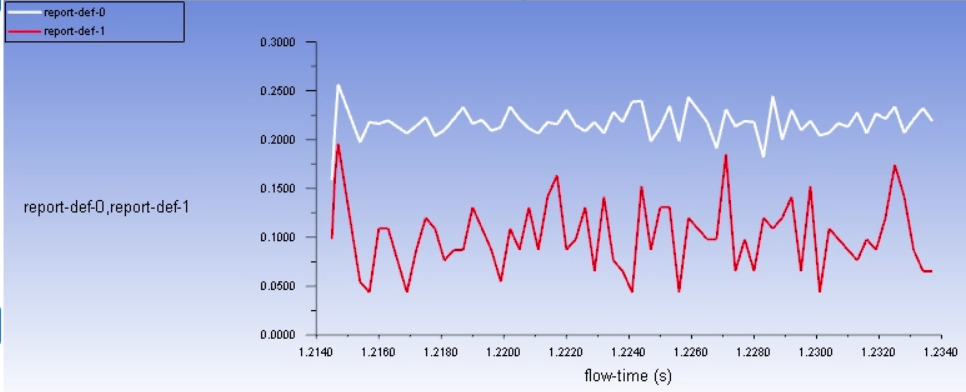
1/Will you check the area-weighted average report definition(below image)? I am trying to simulate annular flow in a 3D pipe. I selected the ANNULAR_WALL(outer pipe surface) as the surface. As it's a transient case, it's reporting a plot of area-averaged variable vs flow-time.
2/I also created a line(line-8) along the wall(axial direction) of the pipe. Should I select line-8 or Annular_wall as the surface during reporting area-weighted average?
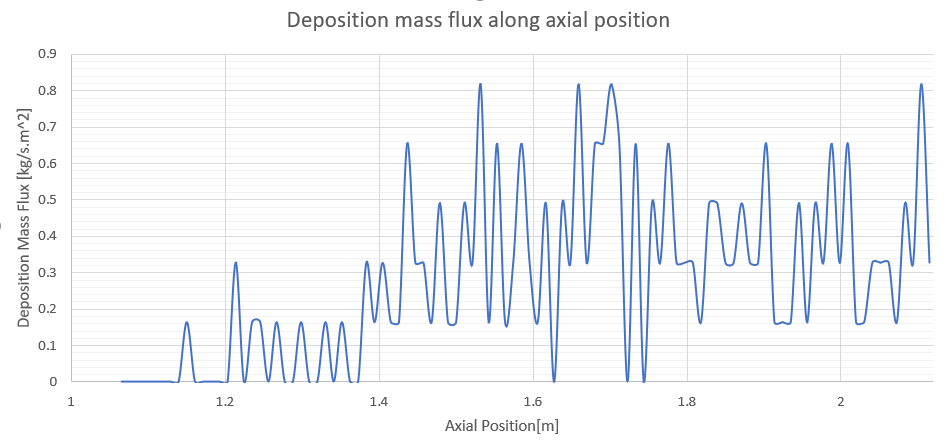
3/ Finally, how can I plot a graph between area-weighted values along the axial direction(axial position) at the end of the simulation?
Regards Anadi
August 18, 2021 at 1:27 pmRob
Forum ModeratorCheck the values once you've initialised the solution, I can't remember if lines have an area or not so the solver may return zero. For an area weighted average v time you need to use a monitor to save that data to file every time step. The data files in Fluent store the instantaneous values only (ie for that time step).
August 18, 2021 at 2:31 pmAnadi_Mondal
Subscriber
1/It's showing the plot for both cases. A white line for annular_wall as surfaces and a red line for line-8(a line on the wall in the axial direction) as surface. So, which one is accurate and logical?
2/Yes, it's showing a graph between area-weighted average vs time(flow-time) but I need to plot area-weighted average vs axial position at the end of the simulation. How can I plot this?
Regards Anadi
August 18, 2021 at 3:06 pmRob
Forum ModeratorBoth are doing what you told them to. You are reporting the area average of a line (or surface) against time. If you want the time average value at points along the axis with time you may want "hoops" and will have several surfaces. Be very careful with your definitions.
August 18, 2021 at 3:13 pmAnadi_Mondal
Subscriber
I want to plot the area average of a line (or surface) vs axial position at the end of the simulation. Is it possible?
"I want to average local values along the circumference of a pipe at each axial position and finally plot the average values at the end of the simulation"
Anadi
August 20, 2021 at 1:27 pmRob
Forum ModeratorAh, the average of an axial position value (ie a band) against the axial position. If you use an axial line then you can only plot on that line, so plot variable against position. To get a band you'll need to create many surfaces along the domain and average on each of those for plotting.
August 20, 2021 at 3:22 pmAnadi_Mondal
Subscriber
Thank you for replying.
I solved this problem by using plot circum-avg-axial command in the console window after finishing the simulation. We can use plot circum-avg-radial for radial direction also.
Regards Anadi
August 20, 2021 at 3:32 pmRob
Forum ModeratorThanks from the graphics https://ansyshelp.ansys.com/account/Secured?returnurl=/Views/Secured/corp/v212/en/flu_ug/flu_ug_sec_plot_circav.html that may be an old feature that didn't make it into the GUI. Can you post a few images of what you get and the surface contour so I can pass to the Product Manager as I suspect we ought to use the function a bit more: I've never used it.
August 20, 2021 at 4:22 pmAnadi_Mondal
Subscriber
Here is the full information from ANSYS.
Anadi
August 20, 2021 at 7:09 pmRob
Forum ModeratorThanks I meant images of your work. I've removed the manual pages as posting those isn't allowed.
August 21, 2021 at 6:44 amAnadi_Mondal
Subscriber
Here I average local values( deposition mass flux) along the circumference of a pipe at each axial position and finally plot the average values at the end of the simulation.
I use plot circum-avg-axial command in the console window to get the average value along the circumference.
Regards Anadi
August 23, 2021 at 10:53 amRob
Forum ModeratorThanks. The fact the results suggest some banding would imply you need more particles. If it's turbulent just stick some more stochastic tries on.
August 23, 2021 at 11:05 amAmine Ben Hadj Ali
Ansys EmployeeI remember there is an old circum average option in Fluent accessible in TUI.
August 23, 2021 at 11:23 amRob
Forum ModeratorThat's the one they're using: I suspect it's a relic from v4 but it's potentially useful so maybe time to move it to the GUI.
Viewing 15 reply threads- The topic ‘How to average local values?’ is closed to new replies.
Ansys Innovation SpaceTrending discussionsTop Contributors-
3150
-
1013
-
945
-
858
-
797
Top Rated Tags© 2025 Copyright ANSYS, Inc. All rights reserved.
Ansys does not support the usage of unauthorized Ansys software. Please visit www.ansys.com to obtain an official distribution.
-