-
-
April 25, 2019 at 9:32 am
Gaddsch
SubscriberHello,
I have a transient data Signal, which is too large to map it on my blade that i want to examine. So i decided to
1) ramp the Mean value of the Data over stream lines to the blades in 5 time steps
2) apply the fluctuations (20.000 points) as point pressure in the most damage expecting regions
3) Do a lifetime Analysis of both added up in one model
I can do step 1 but i do not know how to combine it with step 2, in the same Model.
How to do that in Transient Structural?
Thanks for help!! -
April 25, 2019 at 11:51 am
peteroznewman
SubscriberIs the mean value you are ramping up a pressure load?
Did you try to use two pressure loads? One for mean and one for fluctuations?
The fluctuation pressure load is set to zero for the first five time steps then has non-zero values in step 6.
What do you mean "a transient data Signal, which is too large to map it on my blade"?
I have a transient acceleration that has 3 components and is 42,000 rows long that I am using in a Transient Structural model. I couldn't put those 126,000 numbers into the Mechanical program, it would choke on them, but I could put that data in a text file and use a Command snippet to read that text file when the Solve command is issued.
-
May 2, 2019 at 1:21 pm
Gaddsch
SubscriberHello Peter,
thank you for your answer. Unfortunately i failed to inderstand it properly, could you probably go more into detail about why the first five time steps has to be 0?
To specify to your question:
To map the transient data signal over the streamlines it would generate to much data for my pc (7*20.000*200).
Yes the mean value is a pressure signal as well.
I try to apply the fluctuations (20.000 time steps) to a certain point onto the blade and combine it with the streamline data that consists of the mean pressure at 5 time steps)
Both Signals are the measurement of 4 seconds Data.
So if i understood correctly, you suggest doing both in mechanical via pressure load? how could i do that with the 20.000 time steps Data? I am kinda lost on that part.
Thank your for help (i am kinda bad in describing problems im sry about that!) -
May 3, 2019 at 12:08 am
peteroznewman
SubscriberPlease show a graph of the mean pressure vs. time which you said has 5 steps over 4 seconds.
Please show a graph of the fluctuation from the mean vs. time, which you said has 20,000 steps over 4 seconds.
What is the 7 and the 200 in the equation 7*20,000*200 above?
Please show an image of the blade.
I'm not suggesting anything until I understand your model.
-
May 3, 2019 at 12:19 pm
Gaddsch
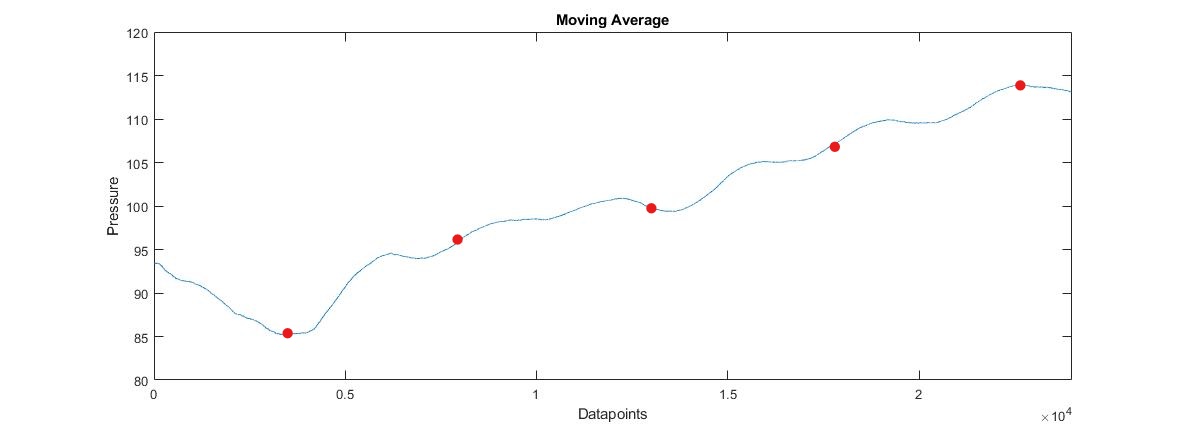
SubscriberSure thing. In the image below you can see the plot of the mean pressure with 5 red dots. I wrote a script to interpolate the pressure value, measured at this specific time step, to the 200 points of the stream line, mapped on the blade that you can see in image 2. This creates a Table, (1) with (xyz)and Pressure.
No i want to ramp from step 1 to step 2 to step 3 etc. Im taking the tabular Data via external data and apply it to the blade.
The fluctuations are the Meassured Pressure-Mean Pressure, measured at the 24.000 points with a sampling rate of currently 2083Hz. I want to apply these points as a transient Data at a specific location on the blade and combine it with the ramped mean pressure.
Last image as explanation of the 7. I got 7 different streamlines starting from topto bottom of the blade.
Hope this makes it more clear. Thank you
-
May 8, 2019 at 12:41 pm
Gaddsch
SubscriberHello Peter, not sure if you got the reply because i posted last update as a topic. Could you suggest me something with the data and plots in the upward post?
Best -
May 8, 2019 at 9:05 pm
peteroznewman
SubscriberThank you for the details. I have a better understanding now.
I don't have anything to suggest but I see you found a very relevant Discussion.
I will be following that to see if anyone can help.
-
May 9, 2019 at 12:22 pm
Gaddsch
SubscriberThank you for your assistance Peter! Appreciate it!
So by your experience, do you see any chance of applying a larger number of transient data to the blade manually? I thought about cutting it down to 20-50 steps and summing up the damage done by that to get at least some life time calculated.
-
- The topic ‘How to apply different forces with different time steps to model?’ is closed to new replies.


- The legend values are not changing.
- LPBF Simulation of dissimilar materials in ANSYS mechanical (Thermal Transient)
- Convergence error in modal analysis
- APDL, memory, solid
- How to model a bimodular material in Mechanical
- Meaning of the error
- Simulate a fan on the end of shaft
- Real Life Example of a non-symmetric eigenvalue problem
- Nonlinear load cases combinations
- How can the results of Pressures and Motions for all elements be obtained?

-
4102
-
1487
-
1318
-
1156
-
1021

© 2025 Copyright ANSYS, Inc. All rights reserved.


