TAGGED: color-scale, mechanical, scale, static-fea
-
-
September 8, 2021 at 4:14 pm
Kirstie
SubscriberI'm currently able to change all values apart from the maximum stress values. As I want to compare different scenarios and ensure they all use the same colour scale so they visually correspond, I really need to be able to change the maximum value appearing on the scale.
For example, I have results for an assembly modelled in 5 scenarios, with maximum recorded vM stresses 0.15, 0.148, 0.16, 0.17 and 0.18 MPa. However, I want to set the maximum value for all them to 0.18 MPa, so that way I can directly compare the stress distribution between the 5 modelling cases. How do I do this?
I read on a forum that it isn't possible to change the maximum value. If this is the case, what software can I use to import the results and change the scale?
Thanks in advance!
September 8, 2021 at 9:23 pmpeteroznewman
SubscriberHere is the default scale. The Max and Min values are in bold on the scale.
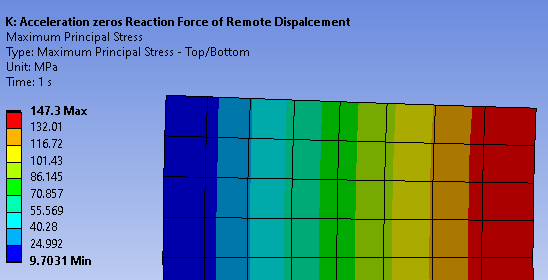 I can type in 0 to 150 over the Max and Min numbers to stretch the range.
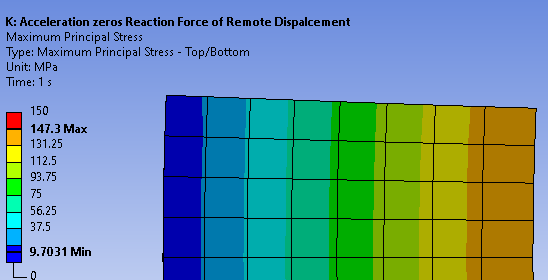 I can type in 20 to 140 over the numbers next to the Max and Min and add some more levels by clicking on a color and clicking the + popup and right clicking to uncheck Max, Min on Color Bar. But you are right, the Max and Min values will always show for those elements that are included in the plot.
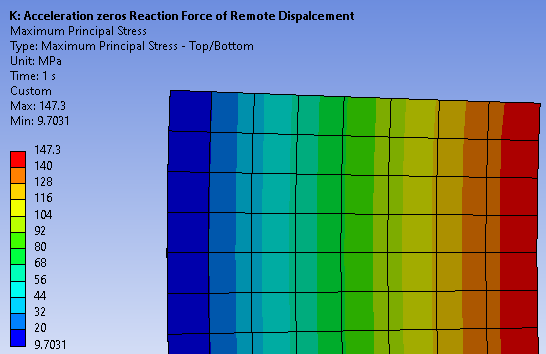 You can Name a color scale you want to use on all the plots. I typed a name called Common Scale.
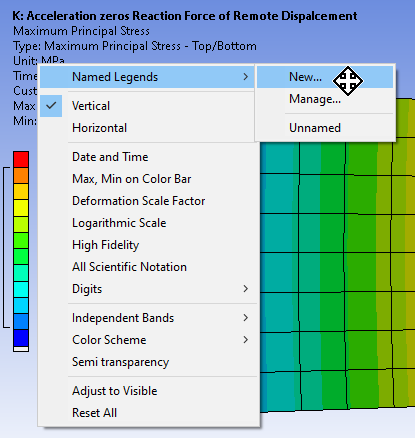 You can Export that to disk then import that into another model.
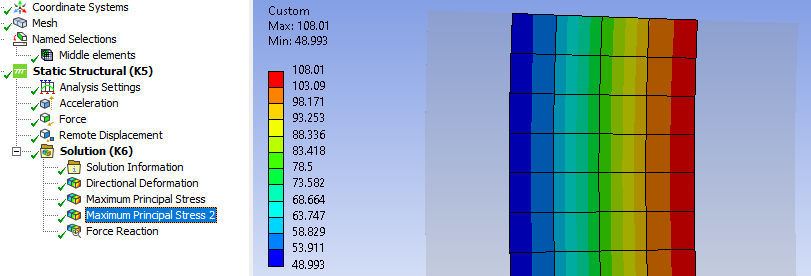
 If you want to make a Named Selection and leave some elements out, you can do that. In the image below, I made a Named Selection and called it Middle Elements.
 September 9, 2021 at 3:48 pm
Kirstie
SubscriberHi , thank you for your reply.
Is there any way of hiding the values in bold so I can present the work in a way that would not confuse others? Or is this something I would have to edit out using something like photoshop? I've noticed that I can hide the maximum and minimum values, but then I'm not able to add a value above the maximum recorded stress value.
Thanks for your help!
September 9, 2021 at 3:52 pmKirstie
SubscriberOh actually no worries, I managed to hide the bold values while still ammending the maximum value shown on the colour scale! I just added the max value to the scale with them displayed in bold, then clicked on the min max colour option and it displayed them. But referring back to your previous comment regarding 20 to 140 over the maximum limit, I assume the maximum value I can set is limited. Is this 20 to 140 range in 0.1 MPa increments or?
September 9, 2021 at 7:33 pmpeteroznewman
SubscriberThe example of 20 t0 140 was to show entering values between the Min and Max. You can only have a limited number of colors on the ribbon. You can type any value you want It could have been 20.3 to 139.9 if you wanted that.
September 10, 2021 at 4:17 pmKirstie
SubscriberOh I see, that makes sense, thanks!
Viewing 5 reply threads- The topic ‘How do I change the maximum value to scale stress results to allow direct comparison?’ is closed to new replies.
Innovation SpaceTrending discussionsTop Contributors-
4607
-
1515
-
1386
-
1209
-
1021
Top Rated Tags© 2025 Copyright ANSYS, Inc. All rights reserved.
Ansys does not support the usage of unauthorized Ansys software. Please visit www.ansys.com to obtain an official distribution.
-


