Part Summary shows the total summation of or mass-averaged variables for each part. Stress is an element variable. It is plotted through contour plot or gauge point.
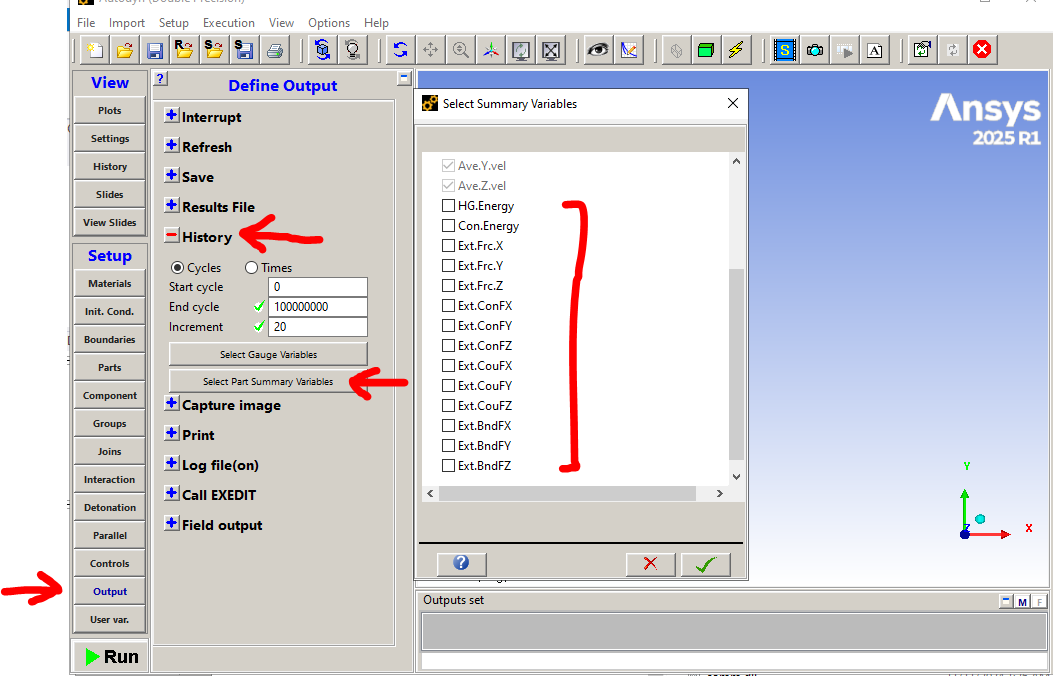
You can add more variables to Part Summary at Cycle 0 via OUTPUT -> History -> Select Part Summary Variables.
See attached picture below, where HG. Energy & Con.Energy represent hourglass energy and contact energy, ExtFrc, Ext.Con, Ext.Cou, ExtBnd represent total external force, total contact force, total coupling force, and total boundary force in X/Y/Z direction of global coordinate system.