-
-
January 13, 2025 at 10:02 am
-
January 13, 2025 at 10:39 am
onse072536
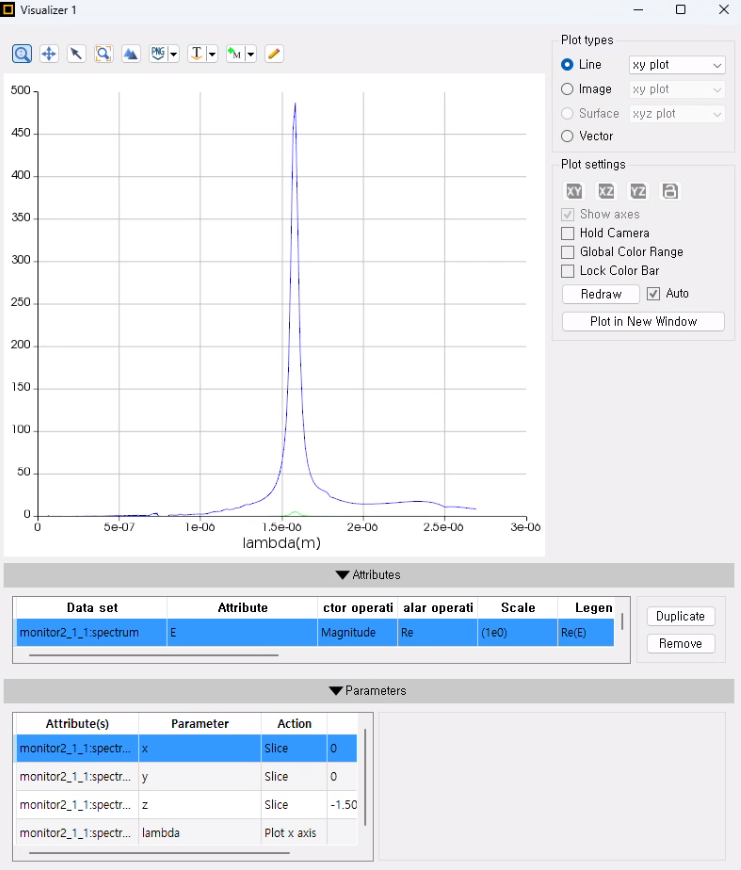
SubscriberWe want to check how much it is transmitted compared to the incident light. What does the y-axis of the data that can be observed on the time monitor mean?
-
January 14, 2025 at 12:25 am
Kirill
Forum ModeratorDear Subscriber,
Based on your screenshot, you are viewing the magnitude of the electric field vs wavelength. This information can be useful for identifying resonances and their spectral positions.
The method for analyzing transmission in nonlinear simulations is described in the article Nonlinear and gain methodology.Best regards,
Kirill
-
Viewing 2 reply threads
- You must be logged in to reply to this topic.
Ansys Innovation Space


Trending discussions


Top Contributors


-
3572
-
1193
-
1076
-
1063
-
952
Top Rated Tags


© 2025 Copyright ANSYS, Inc. All rights reserved.
Ansys does not support the usage of unauthorized Ansys software. Please visit www.ansys.com to obtain an official distribution.


