-
-
February 15, 2022 at 9:26 am
kasparek1
SubscriberHello,
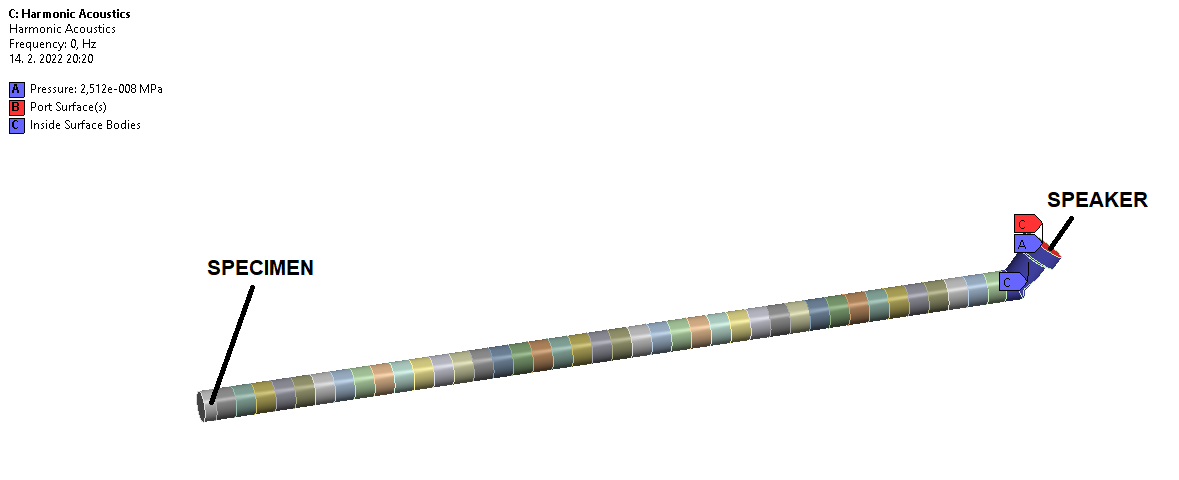
I am trying to perform harmonic acoustic analysis which simulates impedance tube (see picture attached). There is a speaker at one end of the tube and specimen of examined material at other end. The goal is to determine Absorption Coefficient of the specimen. I chose Delany-Bazley model for the specimen (made of PU foam) at the engineering data, so I could assign body of specimen as an acoustic body, as well as the rest of inner volume of the impedance tube.
The problem is the error which shows everytime when I try evaluate the results of Absorption Coefficient (see picture attached): The input power at the driven port is equal to zero. Please check the port definitions. Probably i didn't set boundary condition of "Port" correctly. I set Port to the face of an acoustic source (I also tried to set Port to the face of acoustics body touching the specimen) . The source is defined by setting "Pressure" at the face where the speaker is located. I tried to define source by velocity instead, but the same error occured. Could anybody help me how should I define boundary conditions to evaluate the results of absoprtion coefficient, please?
Any help will be appreciated,
Thanks
K.
February 15, 2022 at 10:38 amErKo
Ansys Employee
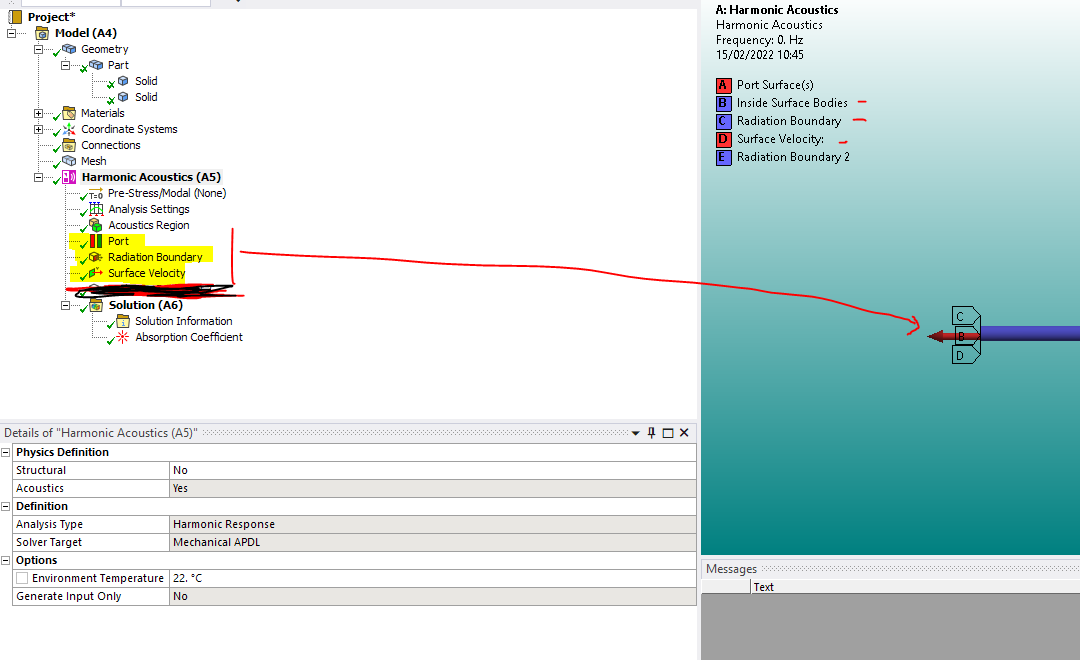
Use the surface velocity as an excitation not pressure. Also define a port at the inlet/excitation and a radiation boundary also at the inlet. The surface velocity for a plane duct wave is just surface_velocity = pressure_source/(density*speed of sound). See below how to set the excitation as explained above.

Also make sure your mesh is connected (not sure why it is split in so many cylinders).
All the best
Erik
February 15, 2022 at 2:00 pmkasparek1
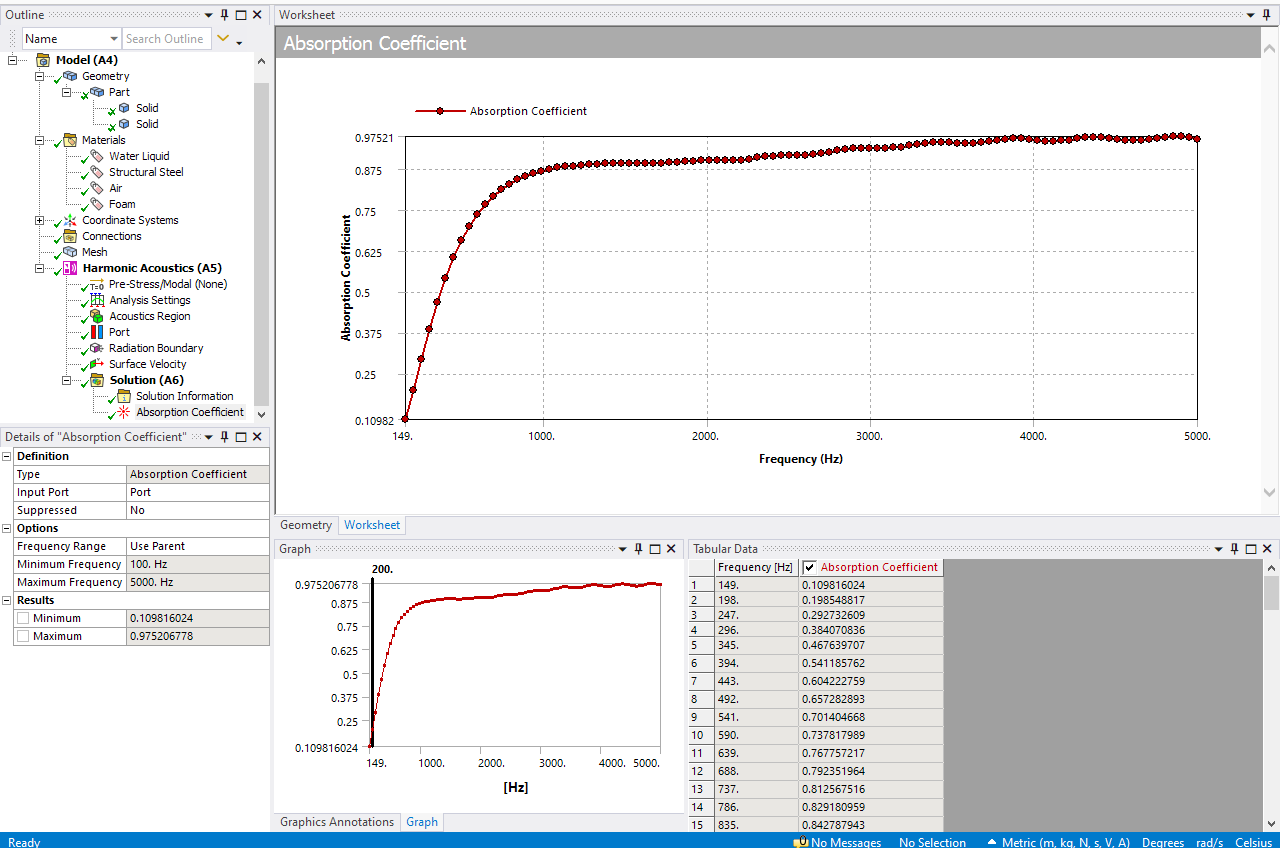
SubscriberHello Erik thanks a lot for your answer. I have set boundary conditions as you described and finally some results of Absorption Coefficient were evaluated. But the trend of it seems weird, it oscillates a lot (see picture). Is it normal or is there some other problem? The solution interval is 50 Hz. I see you have set second Radiation Boundary condition but I dont know where. Could this cause the problem?
To answer your note about mesh: The mesh is connected - I shared topology in spaceclaim. The reason for so many divisions into cylinders is that I wanted to evaluate SPL (dependent on frequency) at more distances from specimen, so there is Frequency Response on all front faces of every cylinder.
Have a nice day
K.
February 15, 2022 at 2:00 pmFebruary 15, 2022 at 2:10 pmErKo
Ansys EmployeeHi
happy to help
"But the trend of it seems weird, it oscillates a lot (see picture). Is it normal or is there some other problem? "
This is hard to say why it does that.
"The solution interval is 50 Hz. I see you have set second Radiation Boundary condition but I dont know where. Could this cause the problem?"
As shown in the image I showed and as explained, the radiation boundary is on the same place as the surface velocity excitation (so at the inlet of the duct).
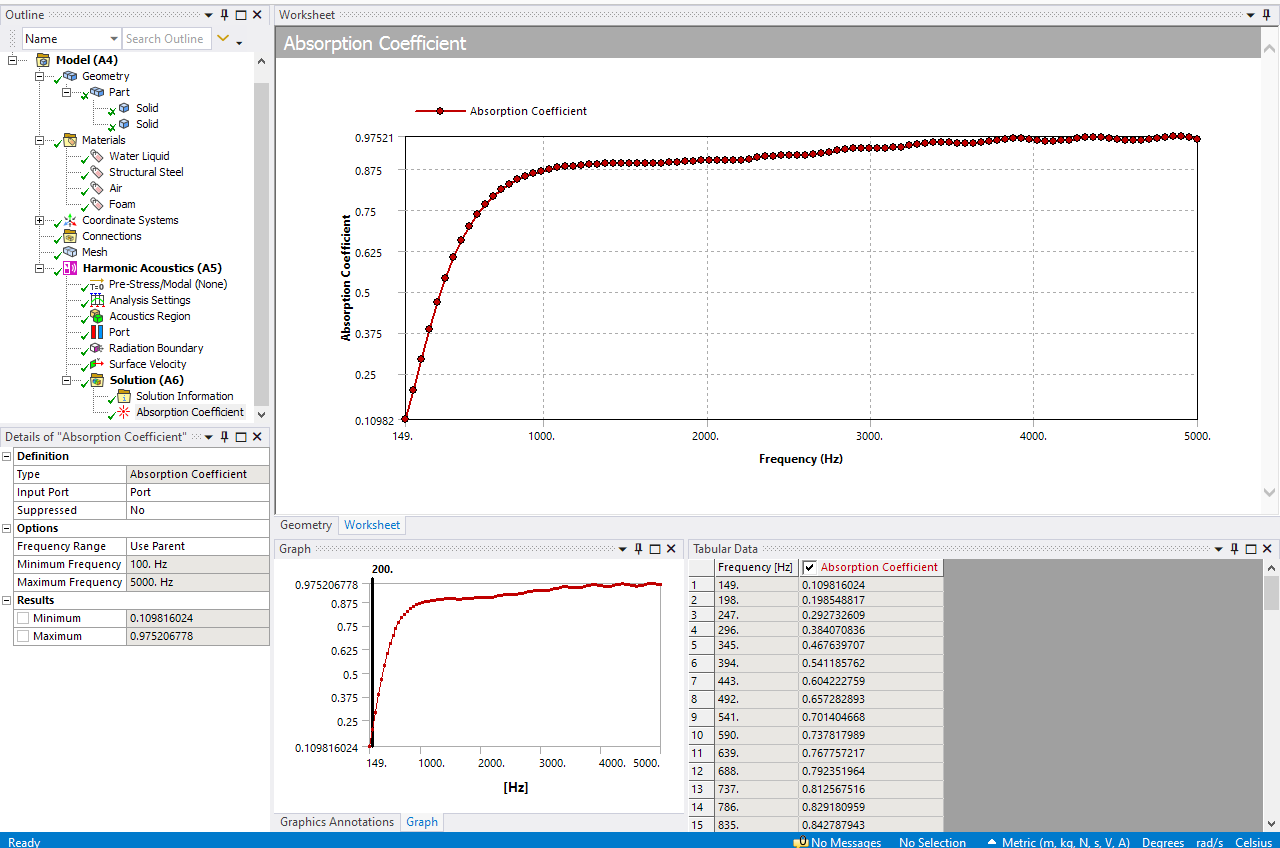
So in theory with this workflow (port, surface velocity and radiation boundary on excitation inlet) we should be able to get a reasonable curve see below:

All the best
Erik
February 15, 2022 at 2:18 pmkasparek1
SubscriberThanks for fast answer!
I was talking about "Radiation Boundary 2" which I cant see at the picture you posted.
Also I have one other question that you may probably know answer for. At the engineering data after I chose Delany-Bazley model, there has to be a Fluid Resistivity value filled. I suppose its a material property for every kind of materal, for example some value for PU foam, different value for mineral wool etc. But its quite hard to find some information about values of Fluid Resistivity for each material. Is there some way I can calculate it?
Thank you K.
February 15, 2022 at 2:24 pmErKo
Ansys EmployeeNo worries.
"I was talking about "Radiation Boundary 2" which I cant see at the picture you posted."
That is not needed (was just something else that we do not need) - so we only need one radiation boundary, on the same place as the surface velocity excitation (so at the inlet of the duct). See below:

The fluid resistivity is a material property and is often given by the manufacturer say of the foam or mineral wool etc. It can be measured with physical testing, but not sure if there is an easy way of calculating it - I would search the web to see if it is possible, but unfortunately that is all that I can help with since we do not have such possibility (to estimate fluid resistivity), since it is a material input from the user.
All the best
Erik
February 17, 2022 at 8:46 pmkasparek1
SubscriberOk I understand. Thank you so much for all the help.
Have a nice day
K.
July 31, 2022 at 4:00 pm-
July 31, 2022 at 4:01 pm
souvikghatak066
SubscriberHow should I apply acoustic region in order to get absorption coefficient value
Viewing 8 reply threads- The topic ‘Harmonic Acoustics – Absorption Coefficient Error’ is closed to new replies.
Innovation SpaceTrending discussions- LPBF Simulation of dissimilar materials in ANSYS mechanical (Thermal Transient)
- Real Life Example of a non-symmetric eigenvalue problem
- How can the results of Pressures and Motions for all elements be obtained?
- BackGround Color
- Contact stiffness too big
- Element Birth and Death
- Python-Script to Export all Children of a Solution Tree
- Which equations and in what form are valid for defining excitations?
Top Contributors-
4597
-
1495
-
1386
-
1209
-
1021
Top Rated Tags© 2025 Copyright ANSYS, Inc. All rights reserved.
Ansys does not support the usage of unauthorized Ansys software. Please visit www.ansys.com to obtain an official distribution.
-


Ansys Assistant

Welcome to Ansys Assistant!
An AI-based virtual assistant for active Ansys Academic Customers. Please login using your university issued email address.
Hey there, you are quite inquisitive! You have hit your hourly question limit. Please retry after '10' minutes. For questions, please reach out to ansyslearn@ansys.com.
RETRY


