你好,感谢解答。因为另外一个英文帖子发了几天没回复,所以又重新提问了一次中文的帖子。我待会儿看看如何删除那篇英文帖子。
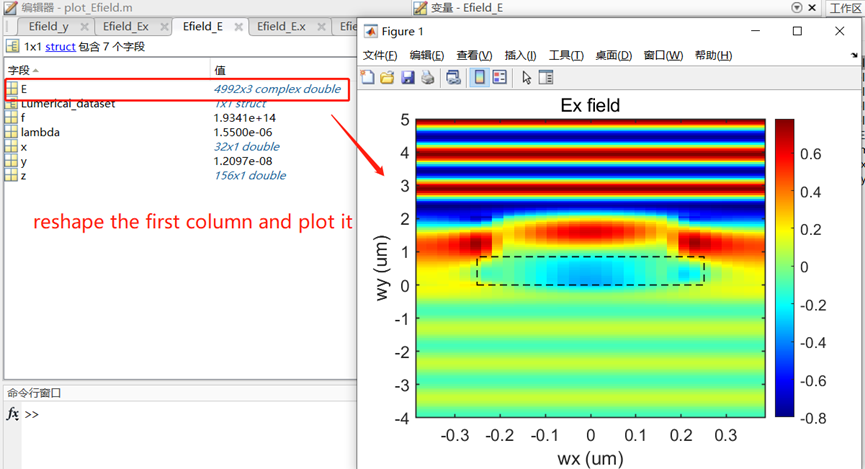
但还有一个疑问,自带的image函数,是会自动适应网格吗?我取原始数据Ex,然后使用image画图,它也可以得出正确结果:
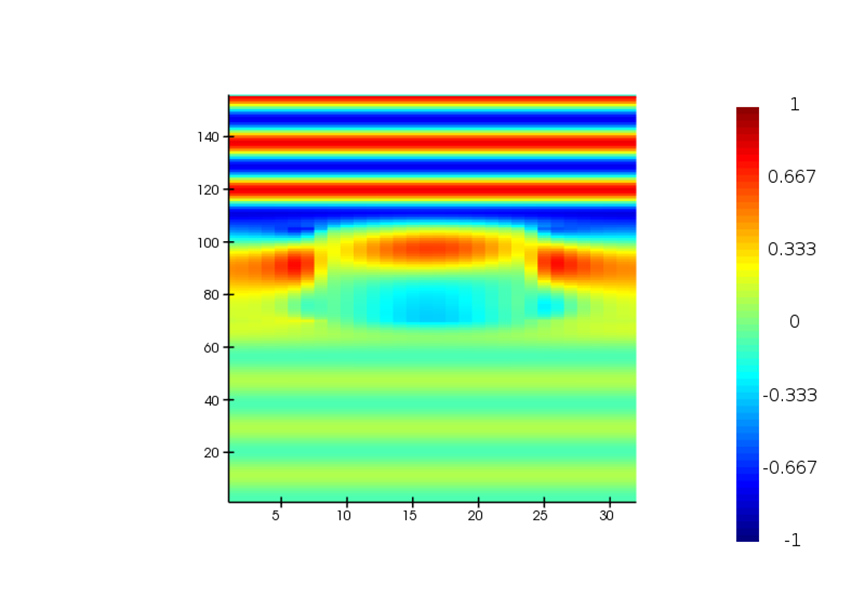
Efield_Ex = pinch(getdata('field','Ex'));
Efield_x = getdata('field','x');
Efield_y = getdata('field','z');
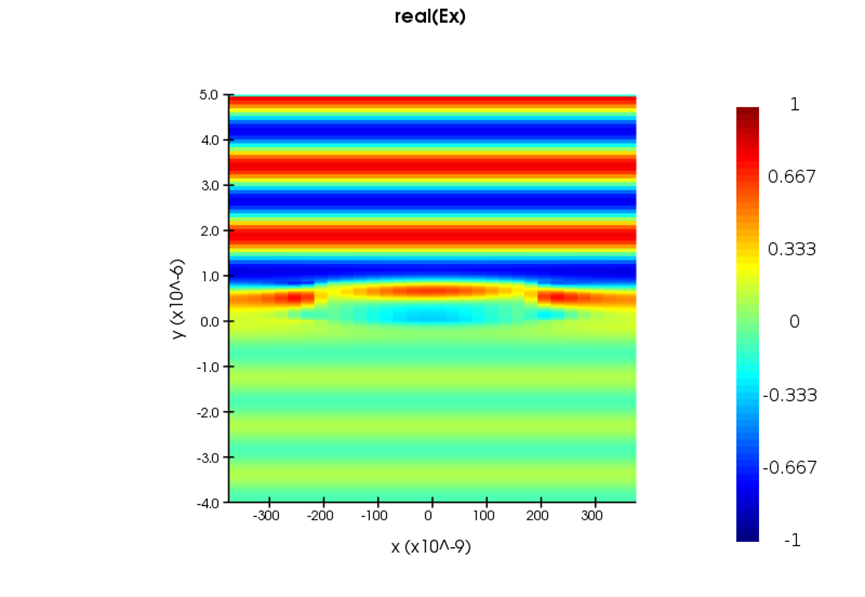
image(Efield_x,Efield_y,real(Efield_Ex),"x","y","real(Ex)");
setplot("colorbar min",-1); setplot("colorbar max",1);
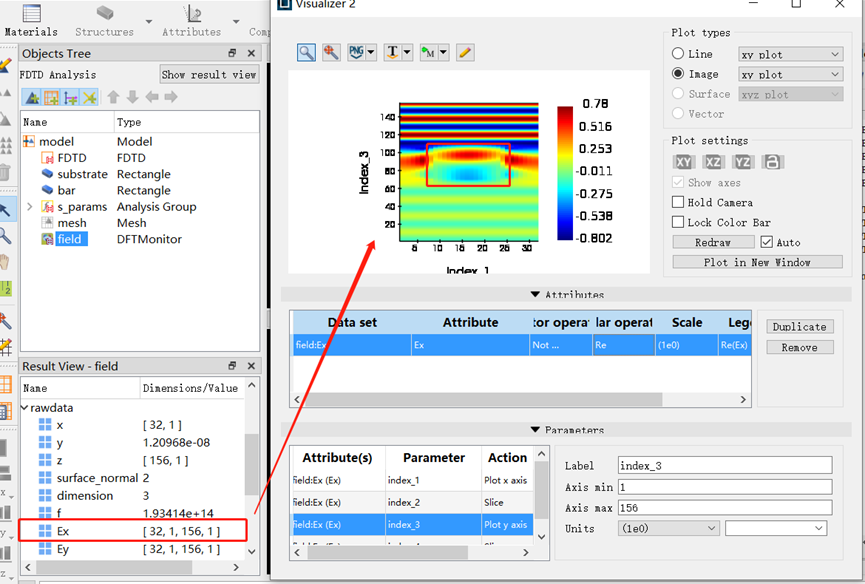
但当我直接画Ex时,它又变形了:
mat_size=size(Efield_Ex);
n1=mat_size(1);
n2=mat_size(2);
image(1:n1,1:n2,Efield_Ex);
setplot("colorbar min",-1); setplot("colorbar max",1);