-
-
July 5, 2019 at 8:03 am
hassam
Subscriber -
July 5, 2019 at 10:31 am
peteroznewman
SubscriberPlease show us the geometry of your model, identify the faces that are in contact, labeled Target and Contact. Show the Contact Details panel so we can see all the settings you have.
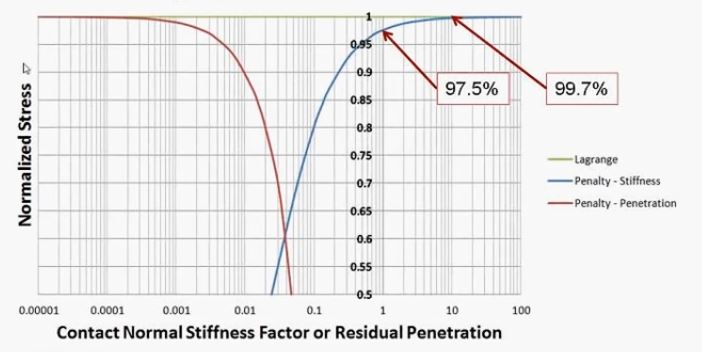
This graph shows two contact formulations: Lagrange and Penalty. Are you only interested in Penalty? If so, why don't you use Lagrange?
What are you going to normalize stress with?
-
July 5, 2019 at 11:15 am
-
July 5, 2019 at 11:37 am
hassam
SubscriberThe model is axisymmetric.
Â
I just need to show how the penetration effects the contact stresses. The graph suggest as the penetration increase the accuracy of the results decreases. I have used interference pressure as a normalizing factor. I also have the possibility to change the penetration value and get the stress level at each penetration value but its a time consuming process. Is there a way to get this kind of correlation directly from Ansys. i am using augmented langrange method.
Â
-
July 5, 2019 at 12:05 pm
peteroznewman
SubscriberIt seems you will have to manually create each data point you want on the graph. The penetration value does not support Parameters.
-
- The topic ‘Graphical Representation’ is closed to new replies.
- LPBF Simulation of dissimilar materials in ANSYS mechanical (Thermal Transient)
- Simulate a fan on the end of shaft
- Nonlinear load cases combinations
- Real Life Example of a non-symmetric eigenvalue problem
- How can the results of Pressures and Motions for all elements be obtained?
- Contact stiffness too big
- Test post on Forum – LLM response – SC
- 13-Node Pyramid Element Shape Function
- Element Birth and Death
- Python-Script to Export all Children of a Solution Tree
-
4512
-
1494
-
1386
-
1209
-
1021
© 2025 Copyright ANSYS, Inc. All rights reserved.


