-
-
November 3, 2018 at 2:03 pm
abd fs
SubscriberHi everyone,
As you may have seen from my last post (/forum/forums/topic/separartion-flow/) I have been modeling turbulent flow around a ramp 25° . I do not have much experience so please bear with me even if my questions are simple.
I have been wanting to check the U+ vs Y+ values in order to determine if the mesh around at the wall level is fine enough to properly model the different boundary layer regions.
I would like to plot u+ against y+ to have the velocity profile near the walls.
Did anybody already try that?
-
November 3, 2018 at 8:16 pm
Amine Ben Hadj Ali
Ansys EmployeeYes you need to write the functions for u plus and yplus to plot them at a certain position normal to the wall
-
November 3, 2018 at 9:53 pm
-
November 5, 2018 at 8:25 am
abd fs
SubscriberSomeone can help me? With some tips, comments?
Thanks.
SERRAR
-
November 5, 2018 at 10:58 am
Rob
Forum ModeratorThe velocity profile can be plotted using a line and an xy plot: you're plotting velocity against position (perpendicular to the wall). Assuming you have a fine enough mesh you'll see the expected profile.
y+ is a pre-set value (we decide what we want) and is used to calculate theoretical height of the first cell: I think it's the mid point, but look it up in the manuals. This value can then be plotted from Fluent, but only really exists as data on the wall, to check if your mesh is fine enough.
u+ is also another derived term, and you've put the curves in your earlier post.
Edit: moved to Fluids
I'm not sure why you'd need to use CFD to plot the u+ against y+ curve?
-
November 12, 2018 at 9:20 pm
abd fs
SubscriberDear all,
I am having extreme difficulty getting this to work. Likely because I have no clue what I am doing.
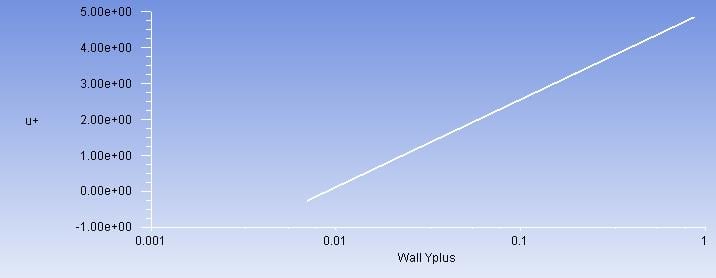
Iam required to compare the law-of-the wall profile to the Uplus v Yplus computed in fluent for a K-omega SST turbulent flow.Fluent gives Yplus but not Uplus.
I tried defining Uplus as a Custom Field Function, my yplus<1. For uplus =ylus i used

I got
For logarithmic u+
My question is: how can plot the famous TBL curve U+ vs y+, to detect the 3 zones ?
Best regards,
SERRARE
-
November 13, 2018 at 5:52 am
Amine Ben Hadj Ali
Ansys EmployeeYou need to define y+ and u+. Then create a line at a certain position normal to a wall then you can xy plot to plot the profile you want. U+ is the velocity in the cell / square root of wall shear stress divided by the density. -
November 13, 2018 at 7:41 am
abd fs
SubscriberThank you so much AMINE I forgot this,
I will try this and post here the results
Best regards,
SERRARE
-
May 7, 2020 at 12:03 pm
alisul692
SubscriberMr. Abd How you calculate Yplus?
-
- The topic ‘fluent : turbulent flow u+ vs y+’ is closed to new replies.


- Varying Bond model parameters to mimic soil particle cohesion/stiction
- JACOBI Convergence Issue in ANSYS AQWA
- affinity not set
- Resuming SAG Mill Simulation with New Particle Batch in Rocky
- Continuing SAG Mill Simulation with New Particle Batch in Rocky
- Is it able to solve turbomachinery using density-based solver in Fluent?
- Two-way FSI simulation
- Ensight Force_per_unit area_EV
- Question about generating Porous Jumps
- The result in FLUENT differs from CFD Post

-
4567
-
1494
-
1386
-
1209
-
1021

© 2025 Copyright ANSYS, Inc. All rights reserved.


