Hello,
I am a PhD student and my research group is working with FDTD simulations to plot the far-field from a dipole source inside a thin film structure. However, we are having difficulties with plotting/interpreting the extracted far-field data. Accordingly, we have a few questions regarding this:
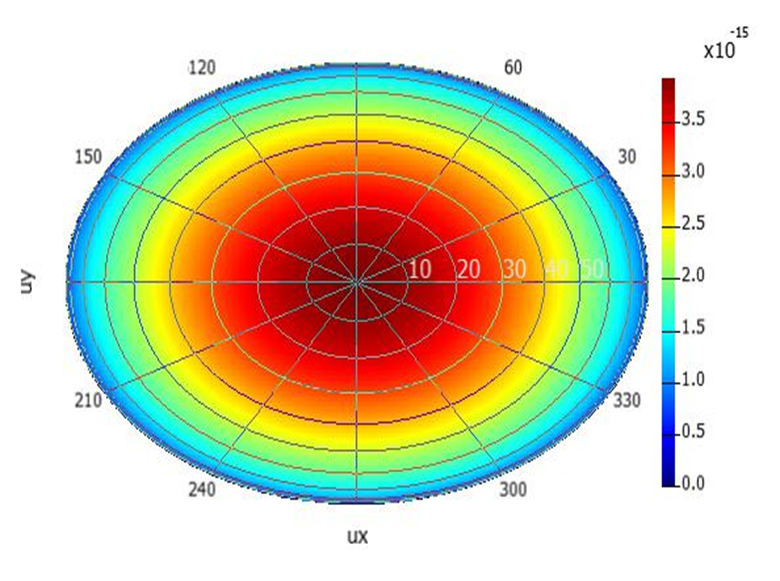
Primarily, we want to recreate the polar plot of the 3D far-field using that can be seen using the visualizer inside the FDTD software using OriginLab software. For example, this image is taken from the visualizer:
We have converted the ux and uy data to values of theta and phi using the script at the bottom of this webpage from the Ansys website: https://optics.ansys.com/hc/en-us/articles/360034410194-farfieldspherical-Script-command
However, we have some confusion about the interpretation of these values.
- From the output of this script, the values of theta range of from -90 to 90. As described here: Understanding direction unit vector coordinates in far field projections – Ansys Optics the fields are calculated on a hemispherical surface located 1 meter away from the simulation region, and the range of theta is from 0 to 180 degrees (0 to pi radians). Why then does script give values from -90 to 90 for theta and what is the physical location of the values from -90 to 0 on the hemisphere/polar plot?
- In general, what is the proper way to extract this data and plot in a polar plot in an external software like OriginLab?
Thank you!”


