

-
-
April 26, 2022 at 8:49 am
JinhyeongYoon
SubscriberHi
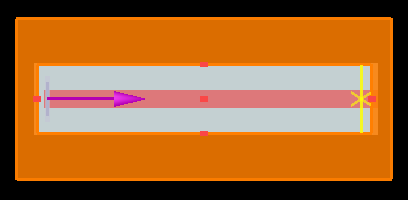
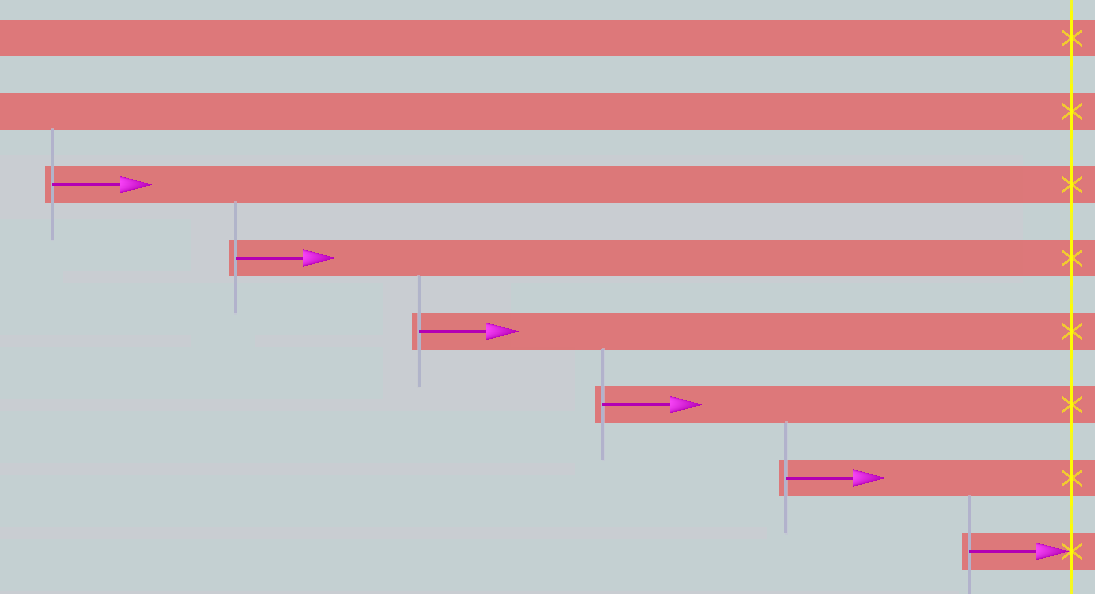
I'm trying to get phase differences between 8 channels, like the picture below.
April 26, 2022 at 6:07 pmGuilin Sun
Ansys EmployeeThere might be a few different issues:
1: The above script is designed for TM mode where Hz dominates. If you use TE mode, you may want to use the dominant field component, eg, Ey, depending on the mode polarization. The time monitors should be located at the peak of the mode intensity. If a minor field is used, the signal is weak so the result can be inaccurate.
2: When you mention that those waveguides are the same, I believe you mean they are isolated, eg, no mode profile extends to the neighboring waveguides. However when the distance between two waveguides are small, the mode can penetrate into the neighbor waveguides. This may cause some issues. You can use a profile monitor and use log scale to check the field pattern.
3: make sure that the mode sources are all on the mesh grids without difference discretely, and their initial phases are the same. In particular the first is very important: In the case of mesh accuracy 2, one wavelength (inside the material) has 10 mesh grids, corresponding to 360 phase change. Therefore half-gird change of the mode source will create 360/20=18 deg phase difference.
4: similarly, the time monitors must also be located at the same location.
But I guess the dominant field might be the main cause.
April 27, 2022 at 2:46 amSubscriberThank you for your reply.
for answer 1 I also tried with Ey component. like this code.
And simulated with the simple waveguide.
---------code-------------
Ey = pinch(getdata("monitor_1","Ey"));
t = getdata("monitor_1","t");
f = linspace(c/1650e-9,c/1450e-9,100);
w = 2*pi*f;
Ew = czt(Ey,t,w)/sourcenorm(f);
phi = unwrap(angle(Ew));
plot(c/f*1e9,phi,"Wavelength(nm)","phase");
-------------------------
The problem is that when I change the plot range of f ( linspace(c/1650e-9,c/1450e-9,100) --> linspace(c/1750e-9,c/1350e-9,100))
the result of phase value always changes with wide variations.
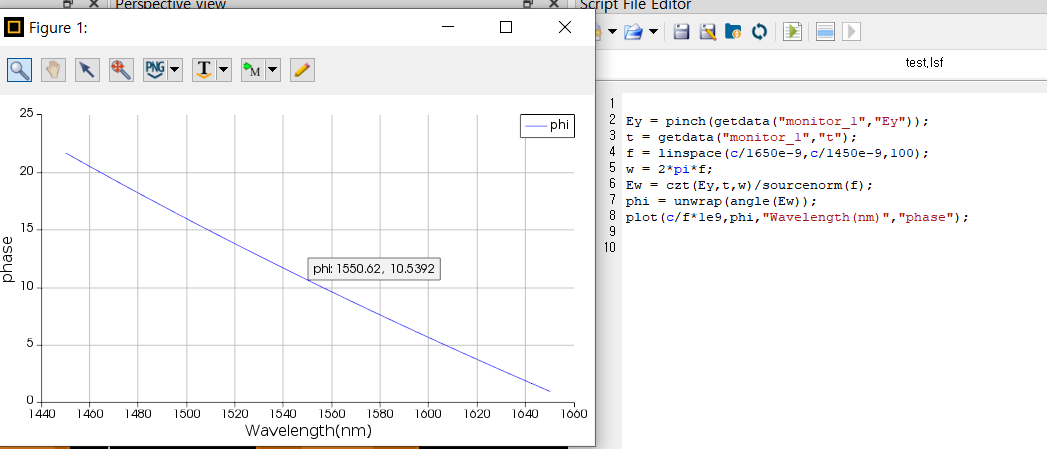
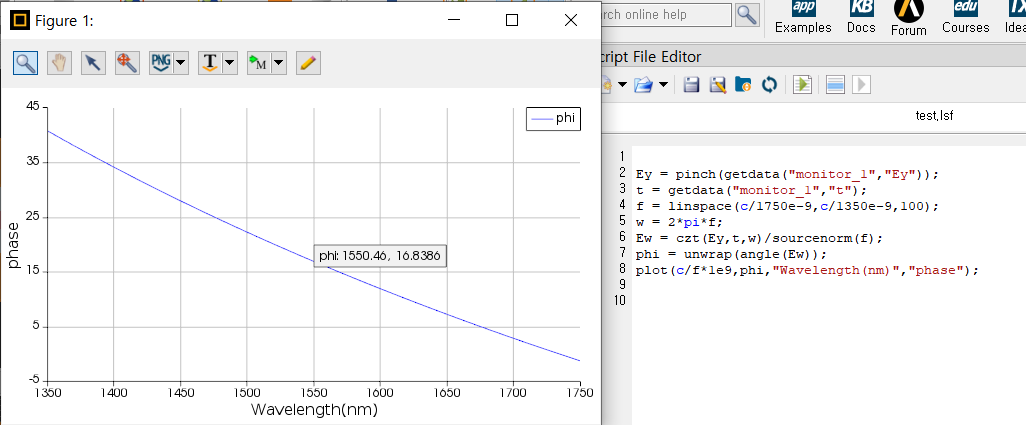
I think the phase value at particular wavelength should be same whenever I change the plot range or not.
There migth be some problems with the code I used.
Is there any other way to extract phase value ?
April 27, 2022 at 4:51 pmAnsys EmployeeYou are right that the phase at a specific wavelength should be fixed in physics.
However, the resulting phase is highly dependent on the mesh size due to numerical dispersion. When the source start wavelength changes, the mesh size will automatically change by default. The mesh change might also be due to material fitting change: when the spectrum changes the fitting may lead to different material data.
To alleviate this problem, please fix the mesh generation and material fitting wavelength range. You can use this:

or more specifically, set them in mesh generation:

and fitting:
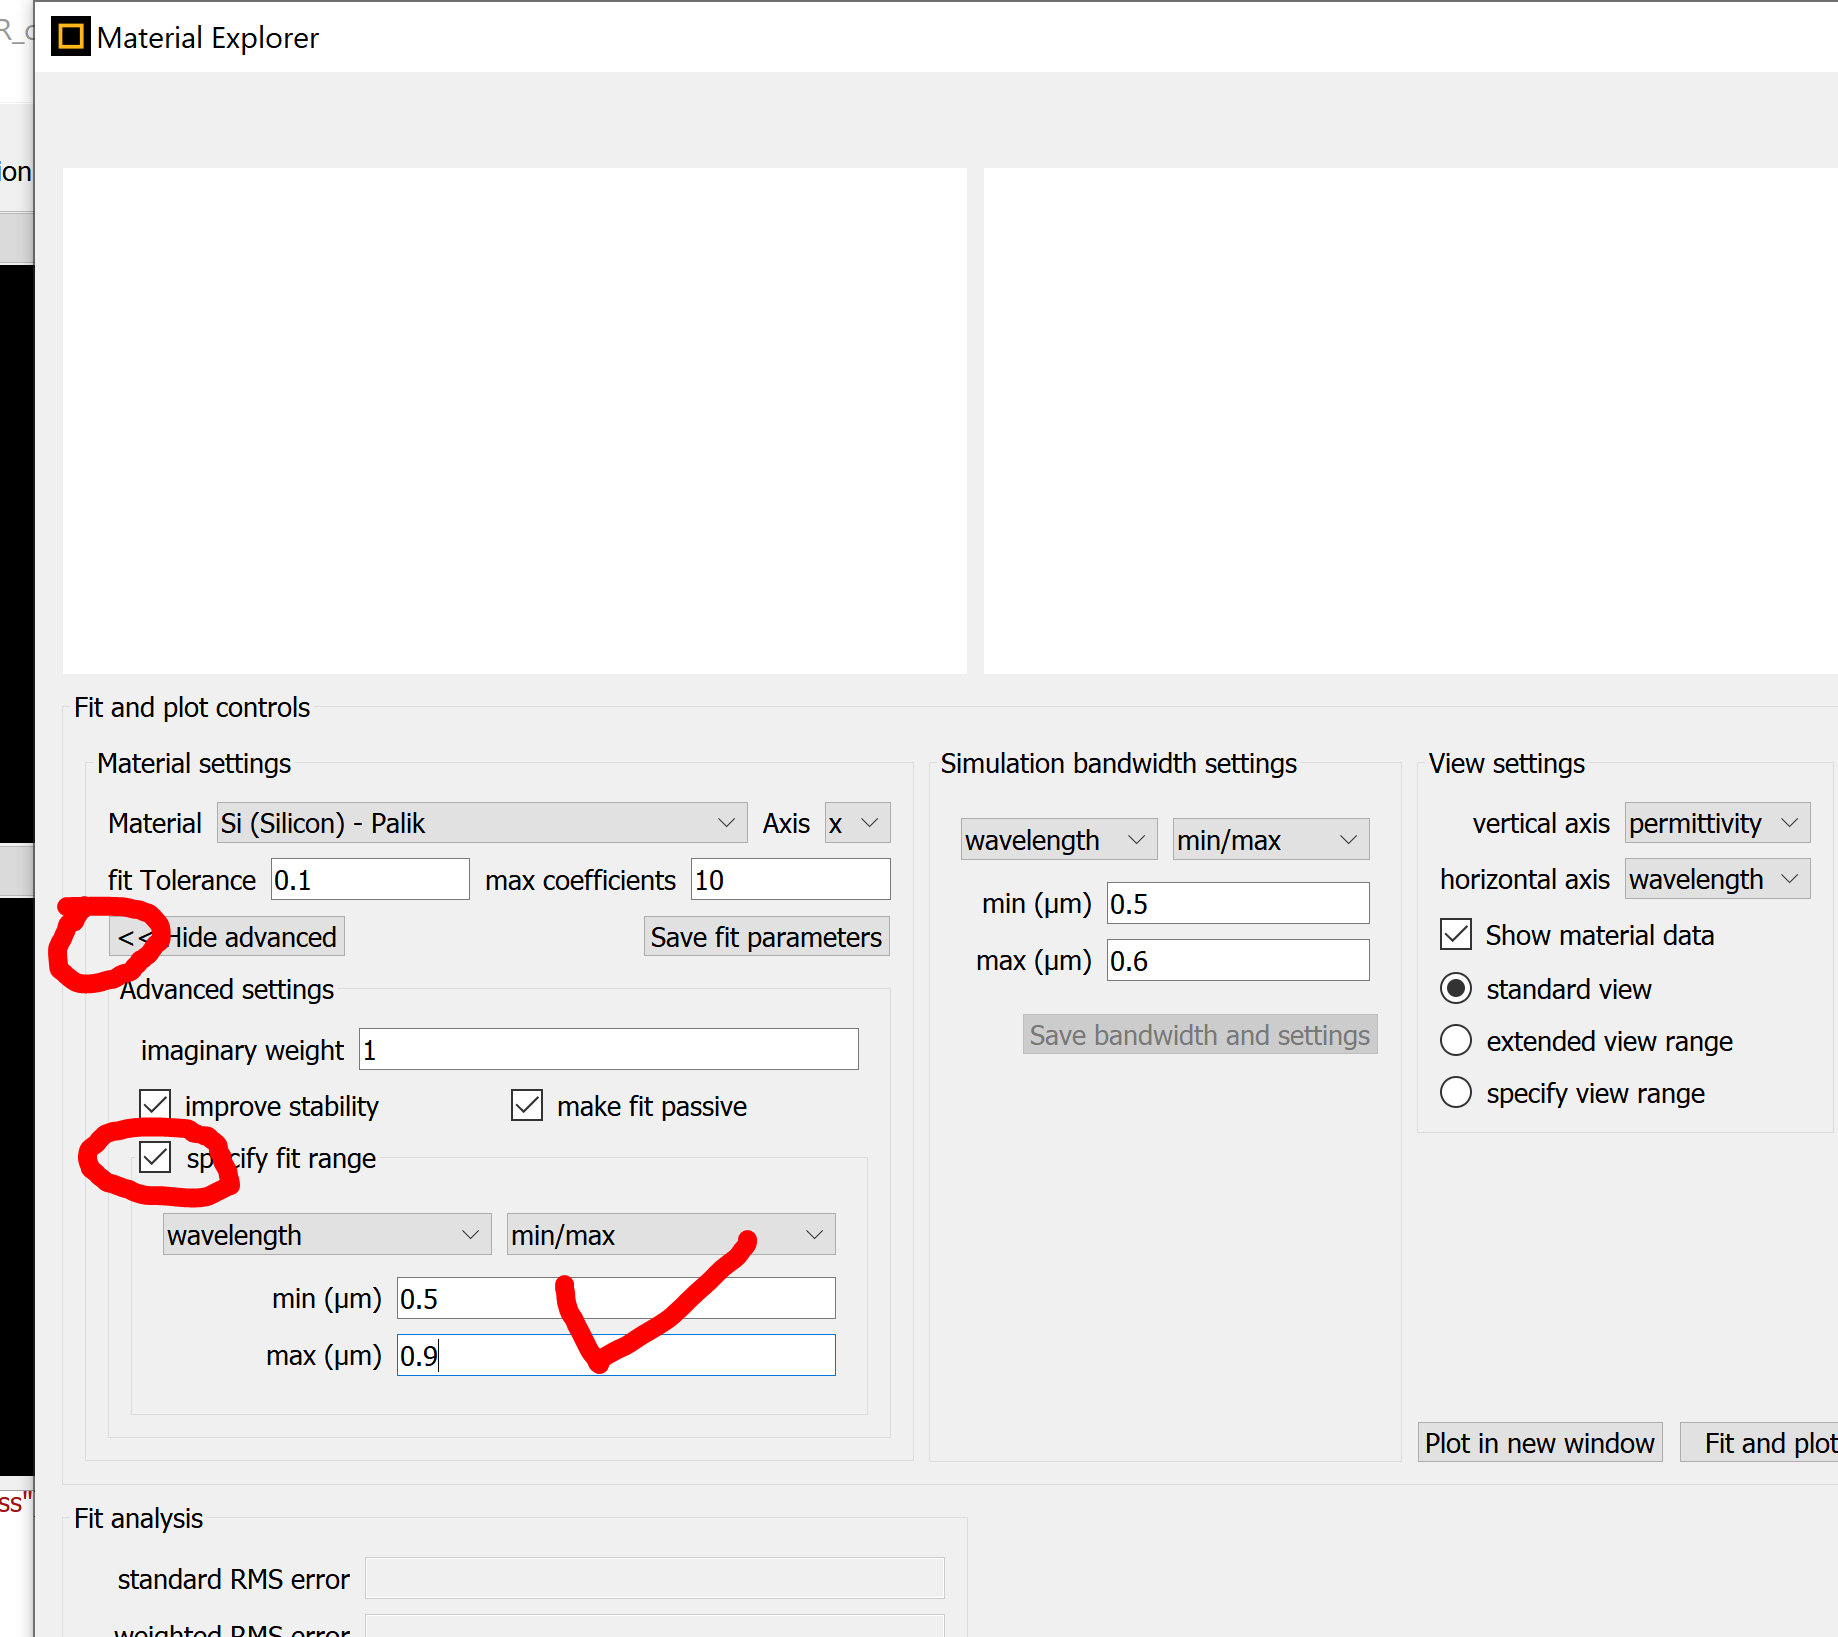 They should lead to the same result. Please try.
Viewing 3 reply threads- The topic ‘FDTD simulation: phase value (phase monitor)’ is closed to new replies.
Innovation Space Trending discussions
 Top Contributors
-
peteroznewman
 5664
5664 -
scabo
 1890
1890 -
Dennis Chen
 1419
1419 -
javat33489
 1304
1304 -
Shyam Prasad V Atri
1021
Top Rated Tags
© 2026 Copyright ANSYS, Inc. All rights reserved.
Ansys does not support the usage of unauthorized Ansys software. Please visit www.ansys.com to obtain an official distribution.
-


The Ansys Learning Forum is a public forum. You are prohibited from providing (i) information that is confidential to You, your employer, or any third party, (ii) Personal Data or individually identifiable health information, (iii) any information that is U.S. Government Classified, Controlled Unclassified Information, International Traffic in Arms Regulators (ITAR) or Export Administration Regulators (EAR) controlled or otherwise have been determined by the United States Government or by a foreign government to require protection against unauthorized disclosure for reasons of national security, or (iv) topics or information restricted by the People's Republic of China data protection and privacy laws.
