TAGGED: lsdyna
-
-
March 9, 2024 at 8:17 pm
mmia1
SubscriberHi
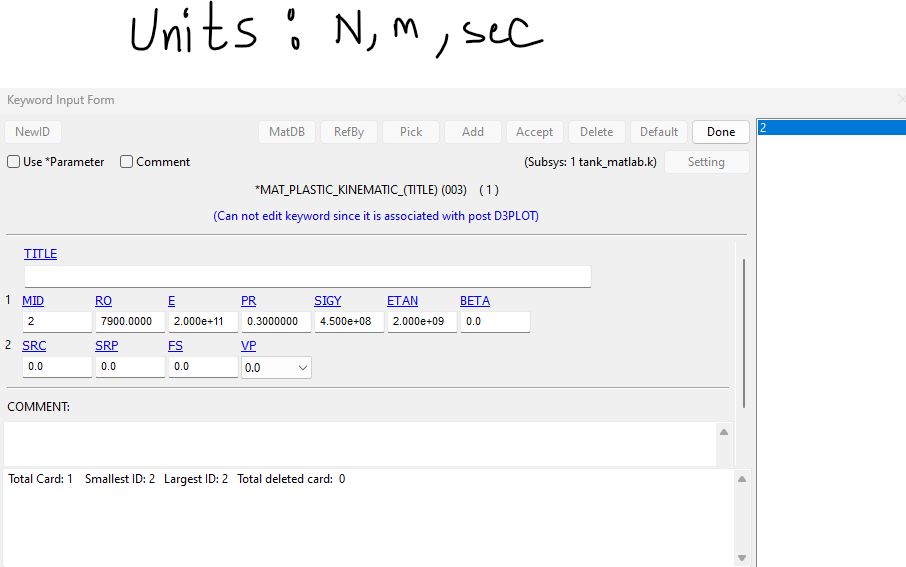
I used "MAT_PLASTIC_KINEMATIC model to model a pipe-tank simulation. The Mat card looks like below:
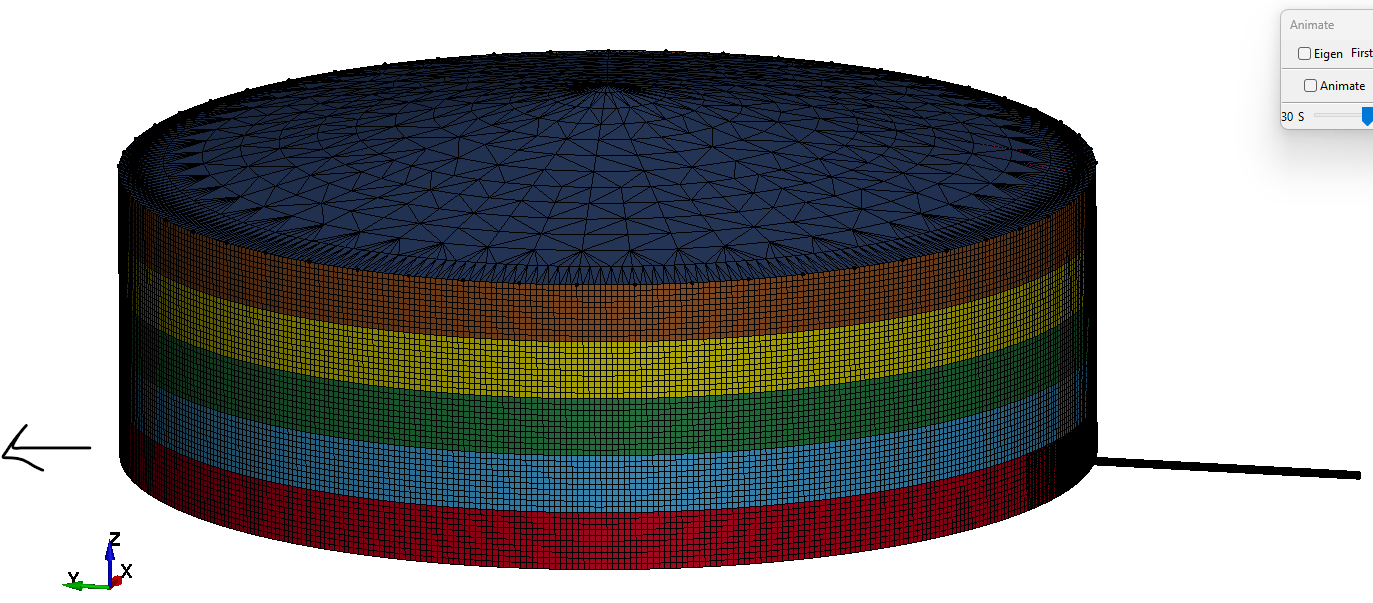
I am applying 0.305 m displacement in +Y direction to represent sliding which looks like below:
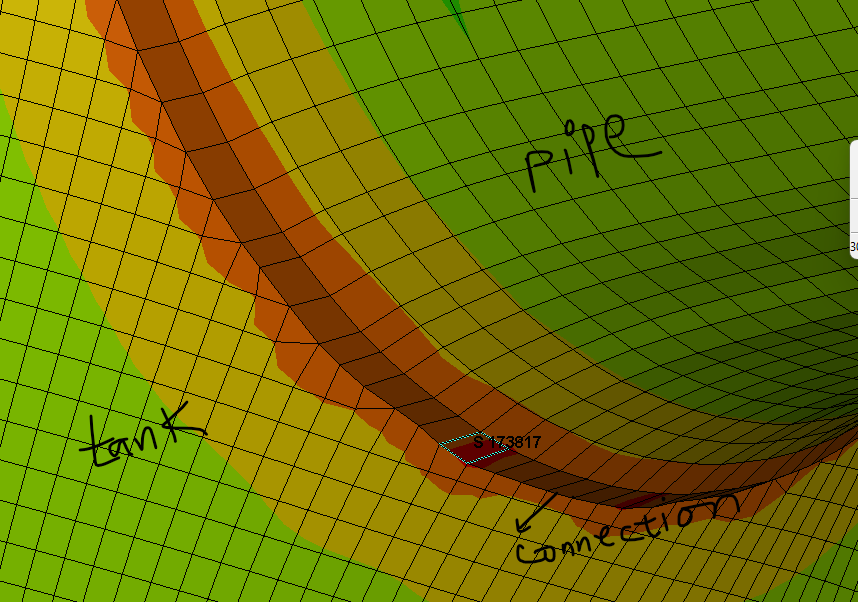
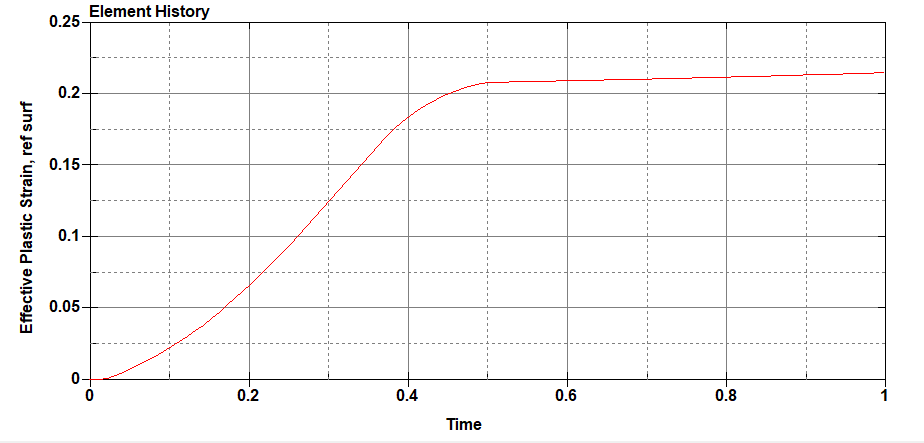
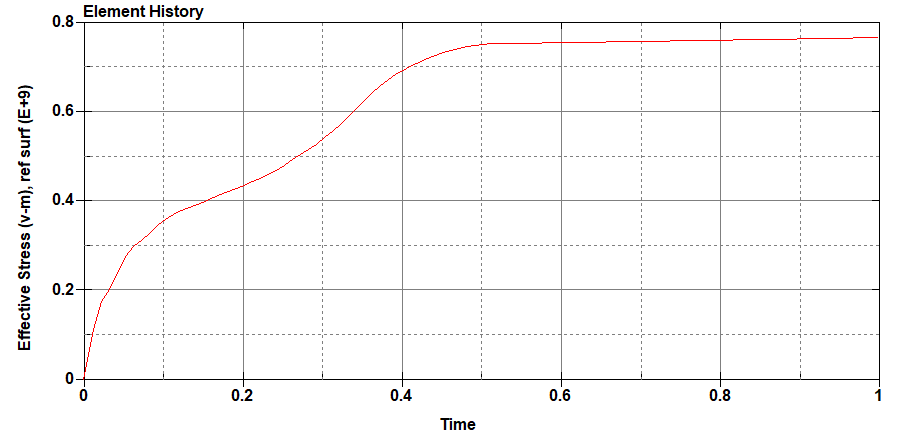
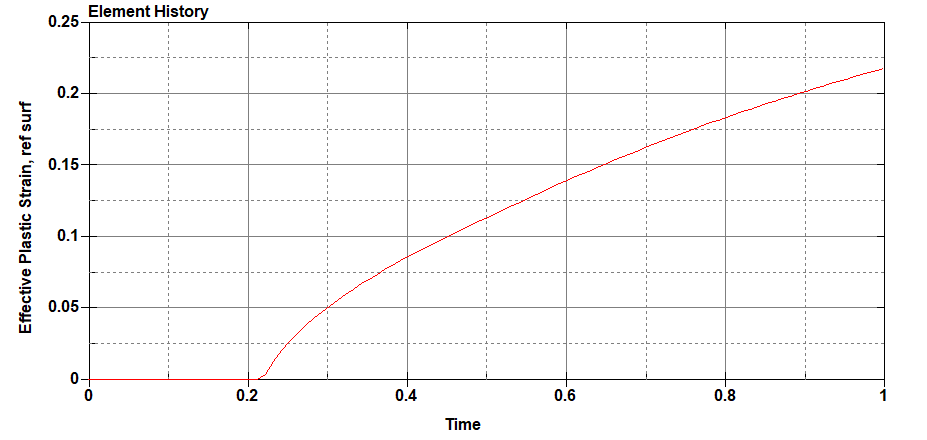
However, when I checked the effective stress at pipe-tank connection nodes, it seems they are not behaving as expected. I checked effective strain at a certain element which has maximum effective stress (at connection between tank and bottom), it looks like below:
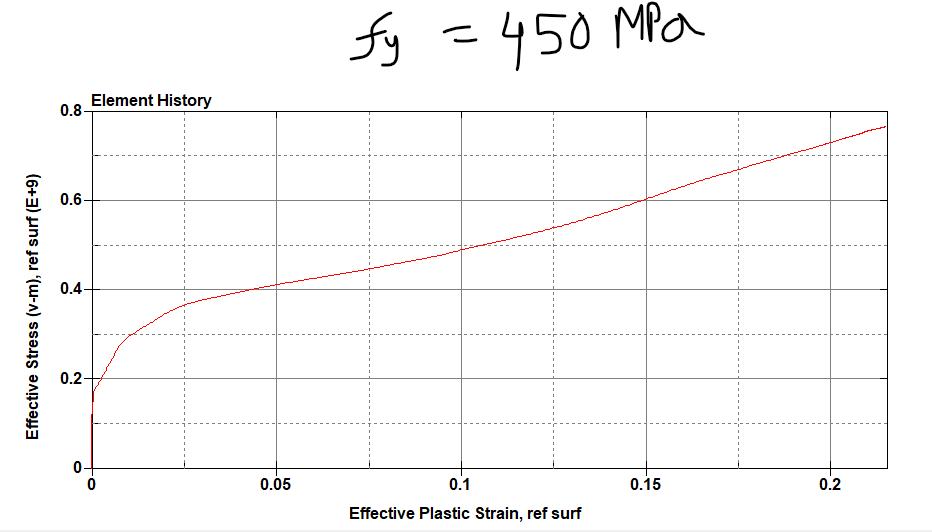
My yield stress was 450 MPa and E = 200 GPa. My yield strain is 0.092. So, @0.092 the stress should be 450 MPa, right? Do you know, why the stress-strain does not look okay? To let you know, I was applying prescribed motion by selecting all bottom nodes of tank in Y direction.
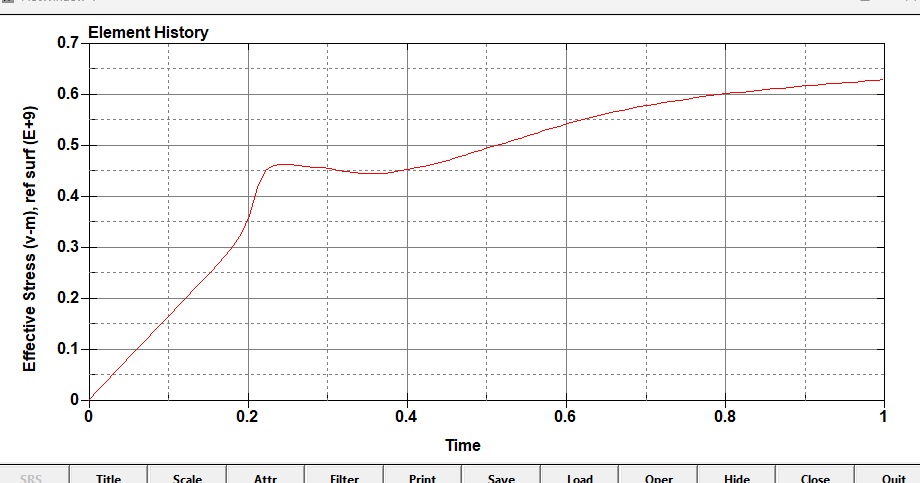
But in other case, when I apply prescribed motion in Z direction to represent flotation of tank, I get expected results which looks below:
-
March 11, 2024 at 1:19 pm
Ram Gopisetti
Ansys EmployeeHi mmia1,
How does your cross between the effective plastic strain vs stress look like? you may not get the elastic zone curve but you can visualize the plastic zone.
Are you using the right elform like -1,-2 here?
Cheers, Ram
-
March 11, 2024 at 3:26 pm
-
-
March 11, 2024 at 4:14 pm
Jim Day
Ansys EmployeePlot effective stress vs. effective plastic strain for one particular integration point and compare that to your input curve.. Shell type 16 has multiple integration points through the thickness (NIP in *SECTION_SHELL) and 4 in-plane integration points.
-
March 11, 2024 at 4:34 pm
mmia1
SubscriberHi Jim
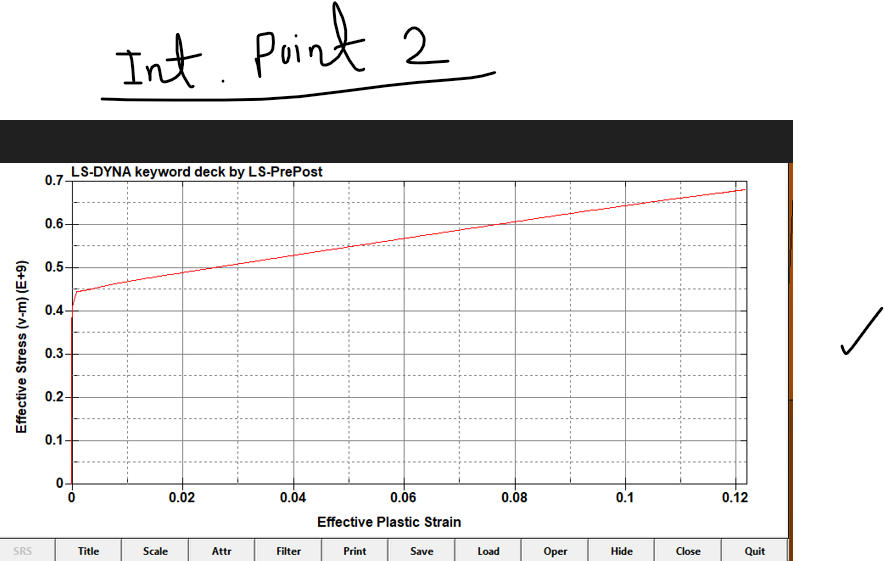
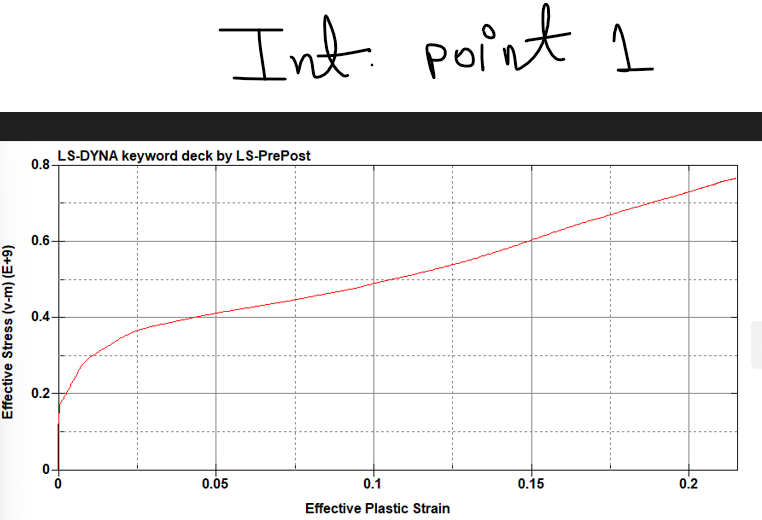
Thank you for your suggestion. I did plot effective stress vs effective strain for the integration points. From d3plot, I saw three integration points 1,2 and 3. When I plot, I am surprised to see that for integration point 2, it matches exactly to my input curve, for integration point 3, some sort of but for integration point 1, it did not match the input curve.
I would be really grateful if you could let me know what is happening here? Why the integration point 2 matches while int point 1 not? Thanks again.
-
-
March 11, 2024 at 6:21 pm
Jim Day
Ansys EmployeePlease confirm that you have NIP=3 in *SECTION_SHELL and MAXINT=3 in *DATABASE_EXTENT_ BINARY. If both are true, then I suspect the problem is due to averaging of the in-plane integration points. Either set ELFORM to 2 (which has only one in-plane integration point) or else try setting MAXINT= -3 so that all 4 in-plane integration points of ELFORM 16 are output. Otherwise, you're getting an average of the 4 in-plane integration points at each through-thickness location.
If NIP=3 and ELFORM=16, there are actually 3 x 4 = 12 integration points.
-
March 13, 2024 at 1:11 am
mmia1
SubscriberHi Jim
Using elform =16 with nip = 5 solved my issues. Thanks.
-
-
March 13, 2024 at 3:25 pm
Jim Day
Ansys EmployeeNIP=3 should also work. Just be sure to set MAXINT=3 if ELFORM=2 and if ELFORM=16, because there are 4 in-plane integration points, set MAXINT= -3 so that data for each integration point is output to d3plot.
-
- The topic ‘effetive stress vs strain curve not as expected’ is closed to new replies.


-
4838
-
1587
-
1386
-
1242
-
1021

© 2026 Copyright ANSYS, Inc. All rights reserved.

