-
-
January 30, 2024 at 4:12 am
Jisung Hwang
SubscriberHello, I would like to ask you a question regarding E-field data in the monitor..
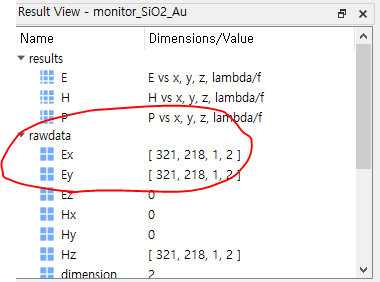
When I check the E-field data size displayed on the monitor, I notice that the total size of each E-field data point is (321, 218, 1, 2).
The dimensions (321, 218) represent the position of each mesh grid point, but I'm uncertain about what the last component, '2', signifies. I don't believe it represents the real/imaginary components of the E-field because the E-field data is expressed as a complex number for each element.
Ex) a = getresult('monitor_SiO2_Au', 'Ex');
   print(a(321,218,1,1)) -> 1.12253+0.722588i
   print(a(321,218,1,2)) -> 0.412319+1.3456i Â
Â
I would deeply appreciate it if I get answers.
Thank you!
Â
-
February 5, 2024 at 7:32 pm
Guilin Sun
Ansys EmployeeIt seems you have the answer by your self. However for the benefits of other users in the forum, I will post my answer here:
Any moitor will be 4 dimension. For frequency-domain monitors, it is xyzf, and for time-domain monitors it will be xyzt. Some dimensions will be singleton. you can use pinch to remove them if you want. it is important when you do matrix operations.
-
- The topic ‘E-field data written in the monitor’ is closed to new replies.
-
3402
-
1052
-
1051
-
896
-
877
© 2025 Copyright ANSYS, Inc. All rights reserved.