-
-
May 24, 2024 at 6:48 am
-
May 27, 2024 at 7:28 am
-
May 28, 2024 at 4:53 am
2202283139
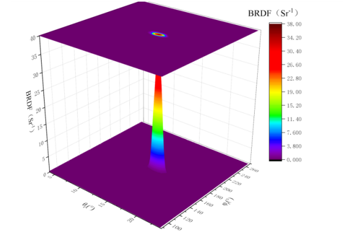
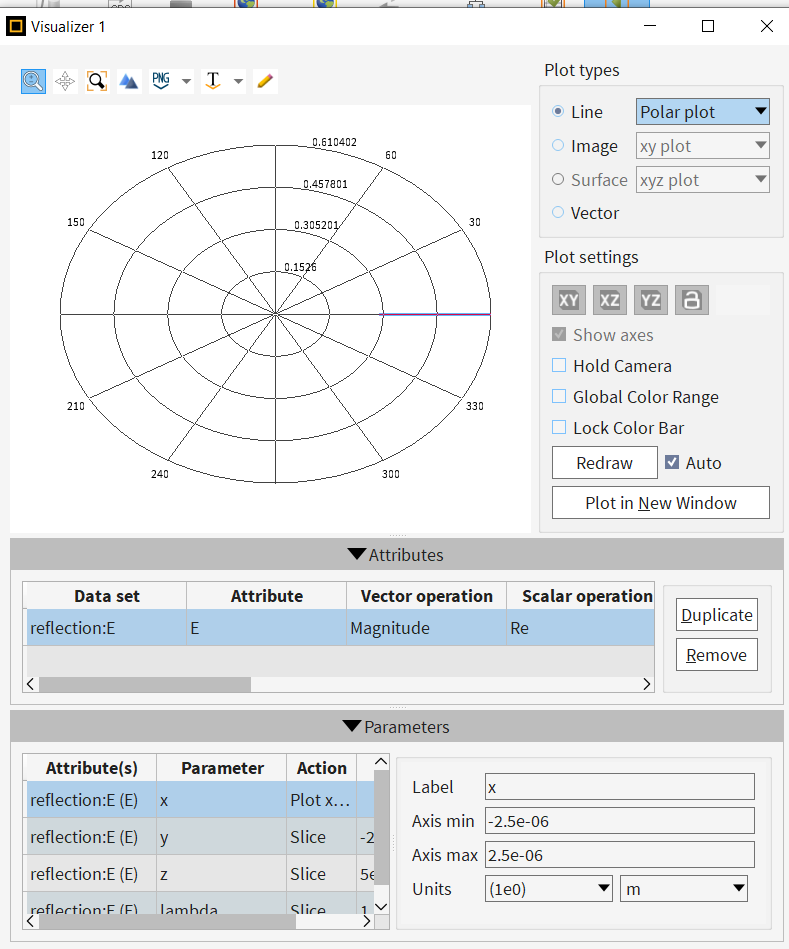
SubscriberAfter the incident light is reflected, I want to obtain the reflectivity or reflection intensity after reflection, and the corresponding angle theta and angle phi of the reflectivity or intensity, and then draw the three-dimensional diagram of the reflected light as shown in the figure, where the x-axis represents the angle theta, the y-axis represents the angle phi, and the z-axis represents the reflectivity or electric field intensity. Previously, the two-dimensional 2d-Z power monitor was normalized by far-field projection to obtain the reflectivity corresponding to each angle theta, as shown in the following figure. I changed the monitor type to 3D, so that it is theoretically possible to obtain the reflectivity of the reflected light at different angles theta and angle phi, and can draw a three-dimensional figure. However, I do not know whether this idea is feasible, and how to extract the three-dimensional data of the 3D monitor for drawing. It seems that the script library of the official website does not draw the script of the three-dimensional map ? The above is my description of the problem, thank you for your reply and answer, look forward to your answer again, thank you.
-
May 28, 2024 at 8:33 am
Niki Papachristou
Forum ModeratorHi subscriber,
Have you come across to this one: Far field projections in FDTD overview?
Would that be something close to what you are looking for? Otherwise, my suggestion would be to exctract the data and create the graph of your preference through lumerical scripting.
Kind Regards,
Niki
-
May 28, 2024 at 9:33 am
2202283139
Subscriber使用fdtd监视器无法提取我想要的数据,即使使用3D监视器,也无法提取反射光在不同位置的方位角、反射角度,最后绘制brdf图。
-
May 28, 2024 at 10:29 am
2202283139
SubscriberUsing the fdtd monitor can not extract the data I want, even if the 3d monitor, can not extract the azimuth angle of the reflected light at different positions, the reflection angle, and finally draw the brdf map.
-
- The topic ‘Draw a three-dimensional map of reflectivity with azimuth information’ is closed to new replies.


-
5094
-
1829
-
1387
-
1248
-
1021

© 2026 Copyright ANSYS, Inc. All rights reserved.


