-
-
November 17, 2025 at 4:11 pm
ll00023
SubscriberI run a coal combustion simulation with DPM model; the coal particles are delivered in the center of the tube.
I made 3 cases: 1: all particles are injected in the same place; 2: 20% mass flow rate of particle injected in the secondary place with 0.19m/s; 3: 20% mass flow rate of particle injected in the secondary place with 0.76m/s (4 times of 0.19m/s); see the green area is much less than that of origin case, so the mass of particle is much less. I don't understand why.
 the DPM concentration of coal particles in 0.19 and 0.76 case are similar, but lower than the origin case;Â
DPM concentration is cell-related value.Â
My thought is: temperature is cell-related value but Grid independent test excludes cell's impact on the value. is there any difference when dealing with particles in ansys fluent.Â
I found a file 1474.pdf to explain how ansys fluent calculates DPM concetration. but I can't access the file.

-
November 17, 2025 at 4:17 pm
Rob
Forum ModeratorHave a look in the documentation from Help in Fluent. I have no idea what that pdf is, but Ansys documentation has been online for a considerable period: pdfs tend to be outdated and potentially harbour code you'd not want to download.Â
Have a look at particle and gas flow speed too. Concentration is a function of the parcel mass, and velocity just determines how quickly the mass is added.Â
-
November 17, 2025 at 8:36 pm
ll00023
SubscriberThank you for your reply rob.
I found the pdf file in customer porter, as shown below.
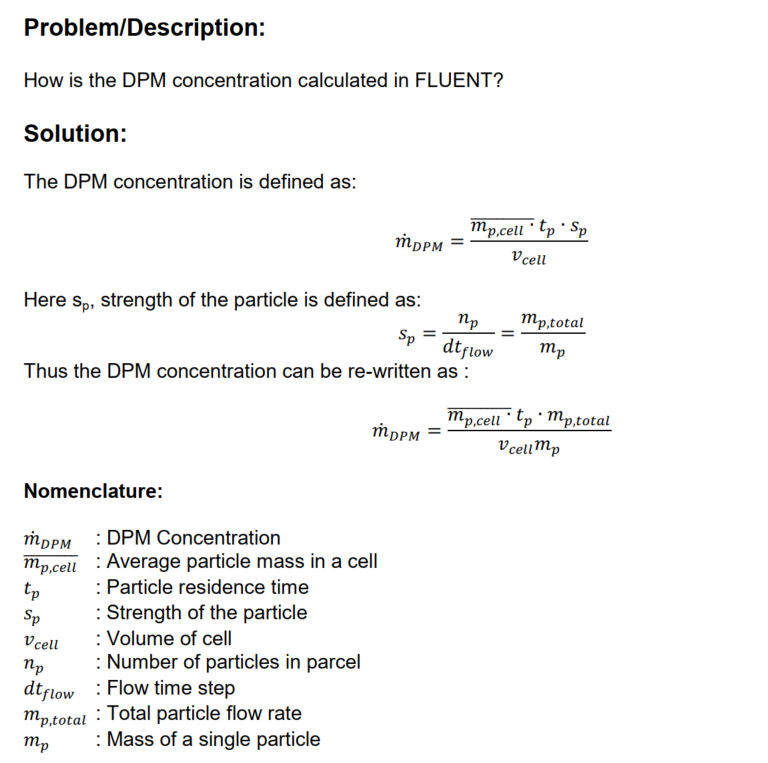
the DPM concentration is associated with particle mass in a cell, particle residence time, total particle flow rate, and mass of single particle.Â
it will be difficult to know the meaning of DPM profile. if it is a high value, it could be high particle residence time, or high particle mass in a cell or high particle residence time or high particle flow rate, or low mass of single particle.
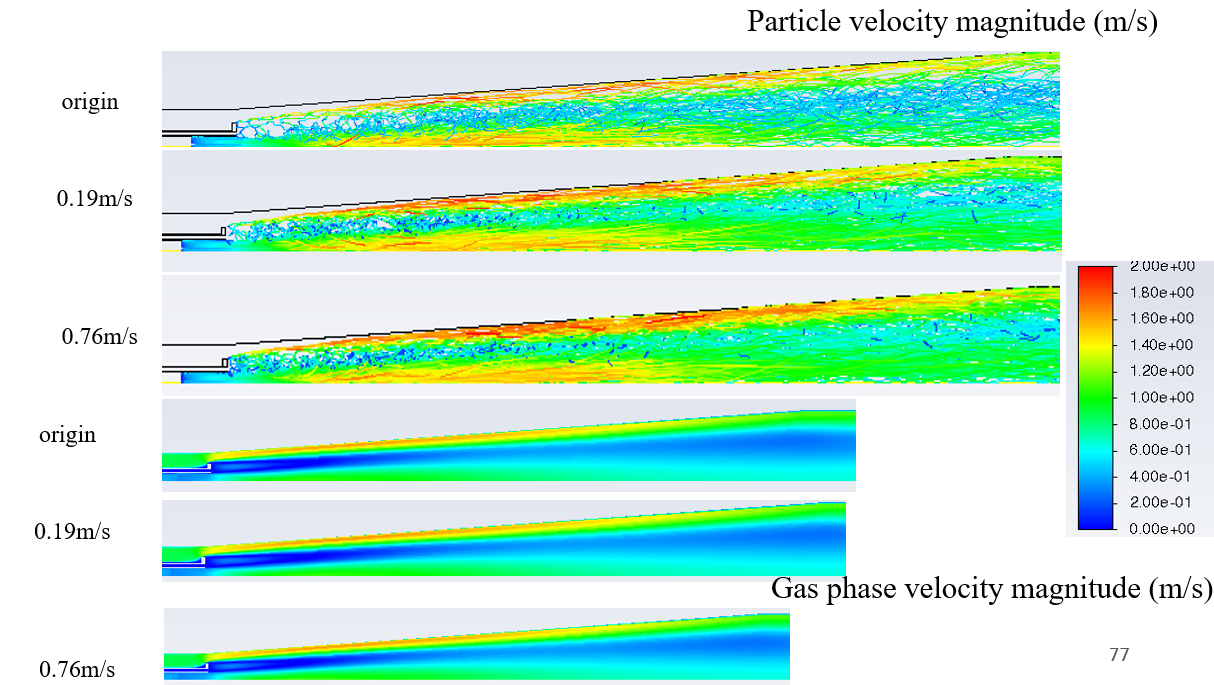
I extracted particle and gas flow velocity. particle velocity profile shows similar pattern of gas phase velocity. I don't know how this result helps explain DPM concentration profile.
when I added another injection surface (almost double injection area), I actually increased the number of particle parcels, which made it difficult for me to identify the reason for the increased particle trajectories in the near burner region. But when I compared case 0.19 and 0.76 m/s, the velocity change did influence the particle number in the near burner region.
Â
-
- You must be logged in to reply to this topic.
- air flow in and out of computer case
- Varying Bond model parameters to mimic soil particle cohesion/stiction
- Eroded Mass due to Erosion of Soil Particles by Fluids
- I am doing a corona simulation. But particles are not spreading.
- Centrifugal Fan Analysis for Determination of Characteristic Curve
- Issue to compile a UDF in ANSYS Fluent
- Guidance needed for Conjugate Heat Transfer Analysis for a 3s3p Li-ion Battery
- JACOBI Convergence Issue in ANSYS AQWA
- affinity not set
- Resuming SAG Mill Simulation with New Particle Batch in Rocky
-
4212
-
1493
-
1375
-
1197
-
1021
© 2025 Copyright ANSYS, Inc. All rights reserved.

