

-
-
March 28, 2021 at 7:31 am
Isha_Engg
SubscriberI have plotted for e.g. flux linkage as a result. I want to define this flux rms in a range as an output variable.
rms from time=0 to time=40us as in the figure.
March 31, 2021 at 9:45 amNavya Chode
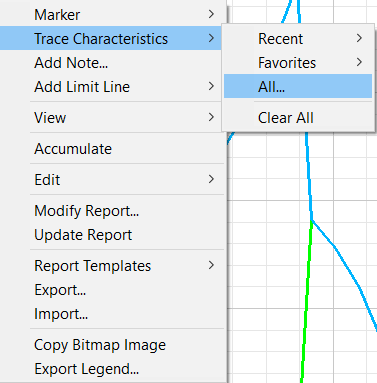
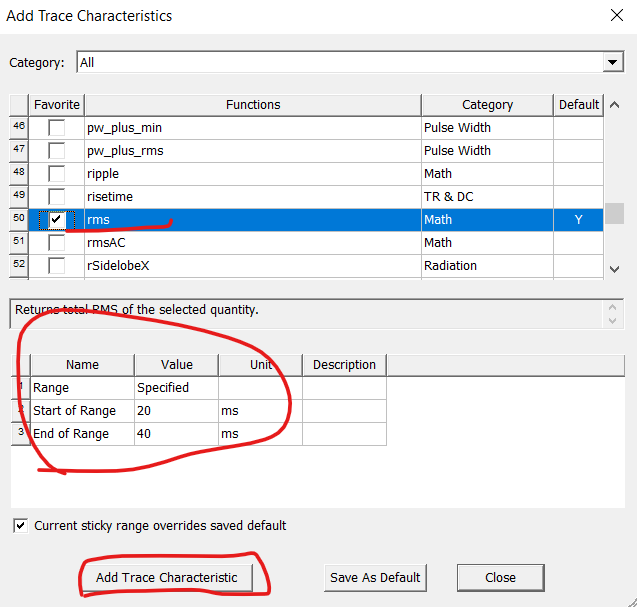
Forum ModeratorHi May I know why you want to add it as an output variable? you can Right-click on the graph and trace characteristics and select rms value with the required time range.
Regards Navya
Viewing 1 reply thread- The topic ‘Defining root mean square from the result rectangular plot as an output variable.’ is closed to new replies.
Innovation Space Trending discussions
 Top Contributors
-
peteroznewman
 4888
4888 -
scabo
 1587
1587 -
Dennis Chen
 1386
1386 -
javat33489
 1242
1242 -
Shyam Prasad V Atri
1021
Top Rated Tags
© 2026 Copyright ANSYS, Inc. All rights reserved.
Ansys does not support the usage of unauthorized Ansys software. Please visit www.ansys.com to obtain an official distribution.
-


The Ansys Learning Forum is a public forum. You are prohibited from providing (i) information that is confidential to You, your employer, or any third party, (ii) Personal Data or individually identifiable health information, (iii) any information that is U.S. Government Classified, Controlled Unclassified Information, International Traffic in Arms Regulators (ITAR) or Export Administration Regulators (EAR) controlled or otherwise have been determined by the United States Government or by a foreign government to require protection against unauthorized disclosure for reasons of national security, or (iv) topics or information restricted by the People's Republic of China data protection and privacy laws.


