-
-
May 6, 2025 at 4:48 am
-
May 6, 2025 at 3:29 pm
Amrita Pati
Ansys EmployeeHi,
Would you be able to share a screenshot of your gain so that I could identify what the issue is?Regards,
Amrita -
May 9, 2025 at 8:24 am
-
June 9, 2025 at 8:03 pm
GWANG
Ansys EmployeeHi wangyizhe,
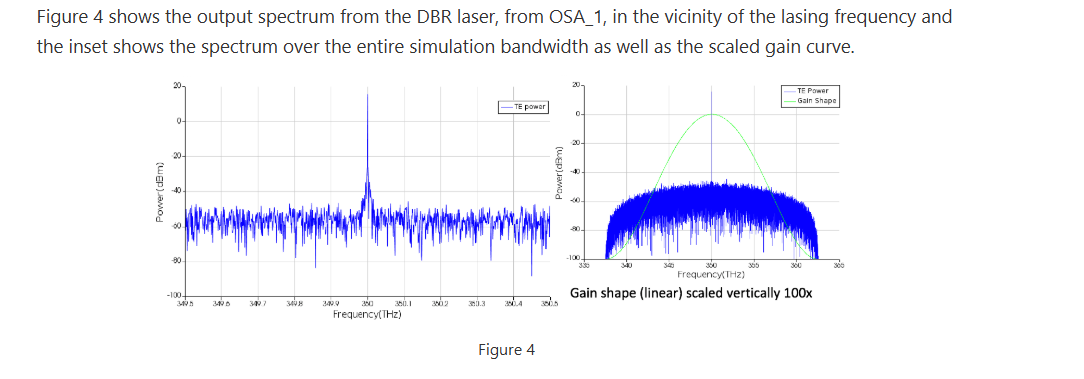
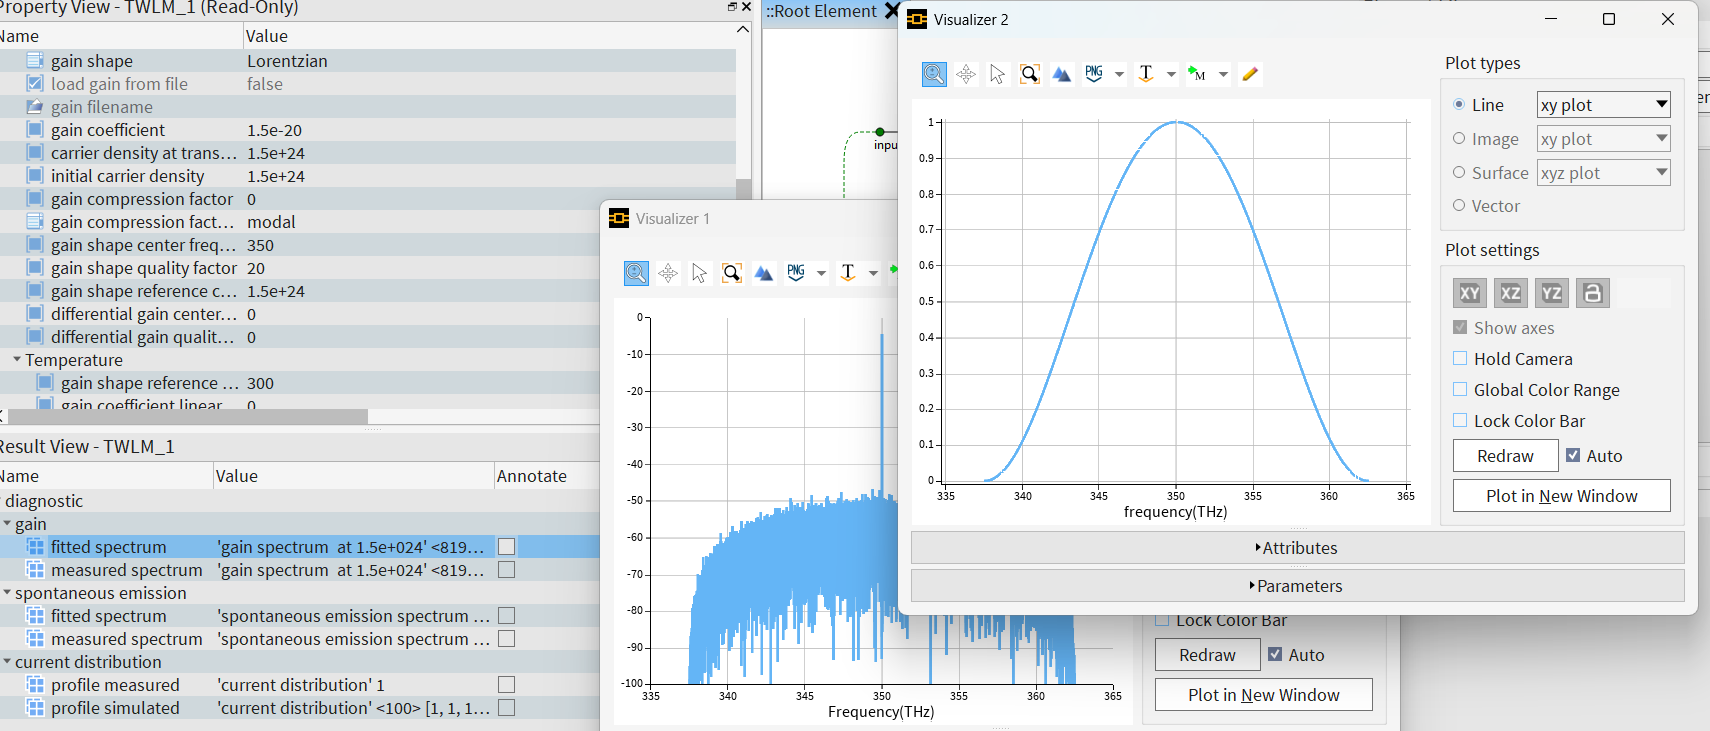
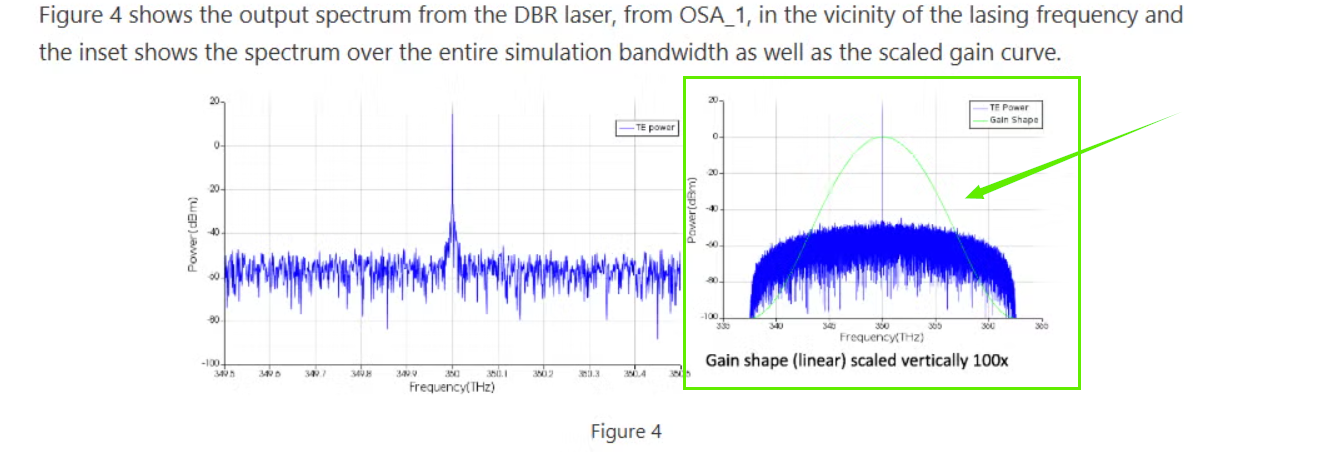
Please let us know which gain curve do you try to get? From the plots it looks like you can generate the gain curve, do you just want to plot them on top of each other?
-
June 10, 2025 at 2:13 am
-
June 10, 2025 at 7:18 pm
GWANG
Ansys EmployeeHi wangyizhe,
You can plot either figure first, then try to right click on the other result entry, and select "add to visualizer..." and choose the corresponding visualizer to add the plot to.
-
Viewing 5 reply threads
- You must be logged in to reply to this topic.
Ansys Innovation Space


Trending discussions


Top Contributors


-
3225
-
1031
-
968
-
859
-
798
Top Rated Tags


© 2025 Copyright ANSYS, Inc. All rights reserved.
Ansys does not support the usage of unauthorized Ansys software. Please visit www.ansys.com to obtain an official distribution.


