Hi Tony,
Thank you for your patience. I would like to explain the details present in the Help file regarding the computing data.
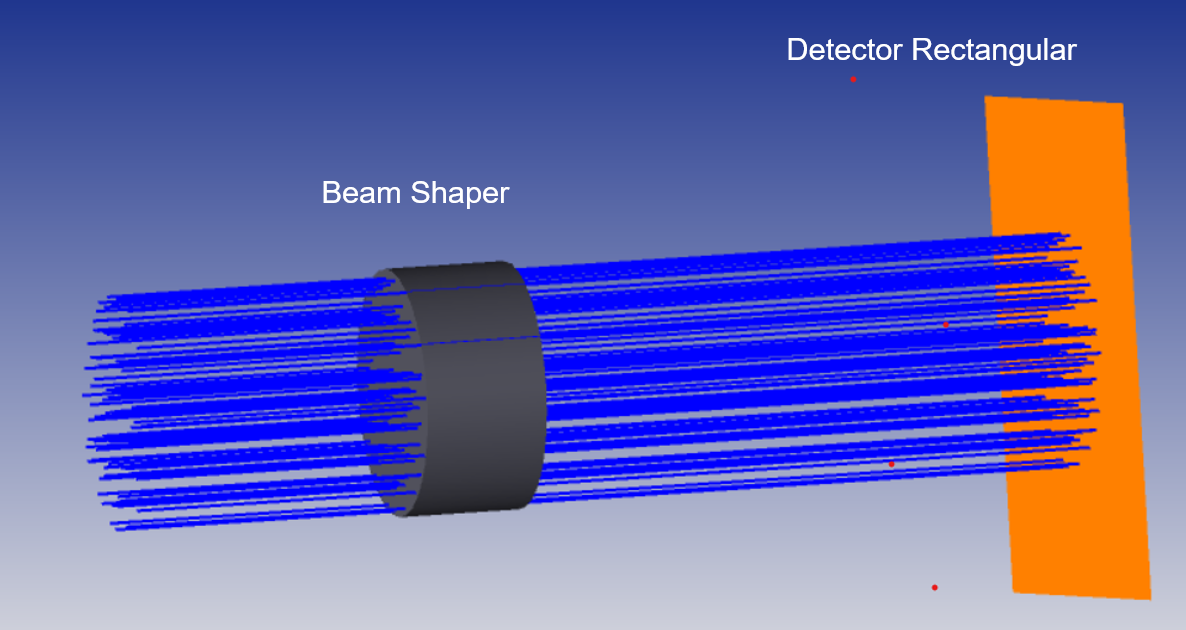
Detector Rectangle Object:
Please have a look at the help file link Detector Rectangle Object >> Comments on detector rectangle angular binning.
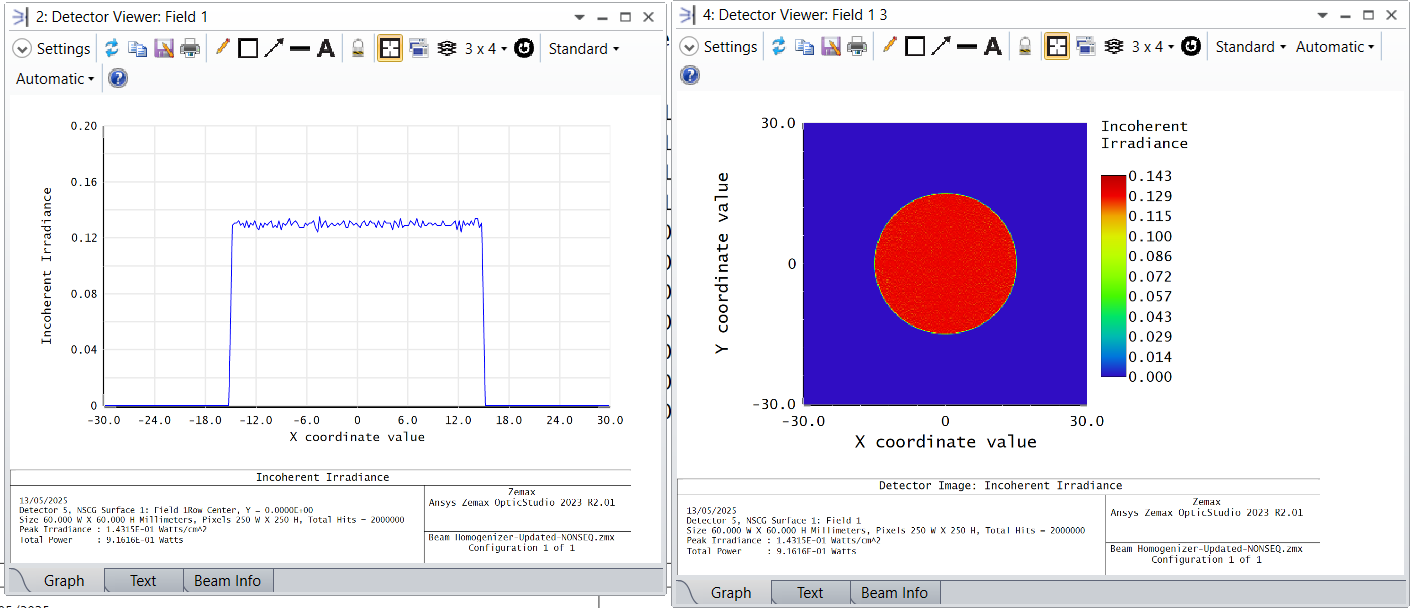
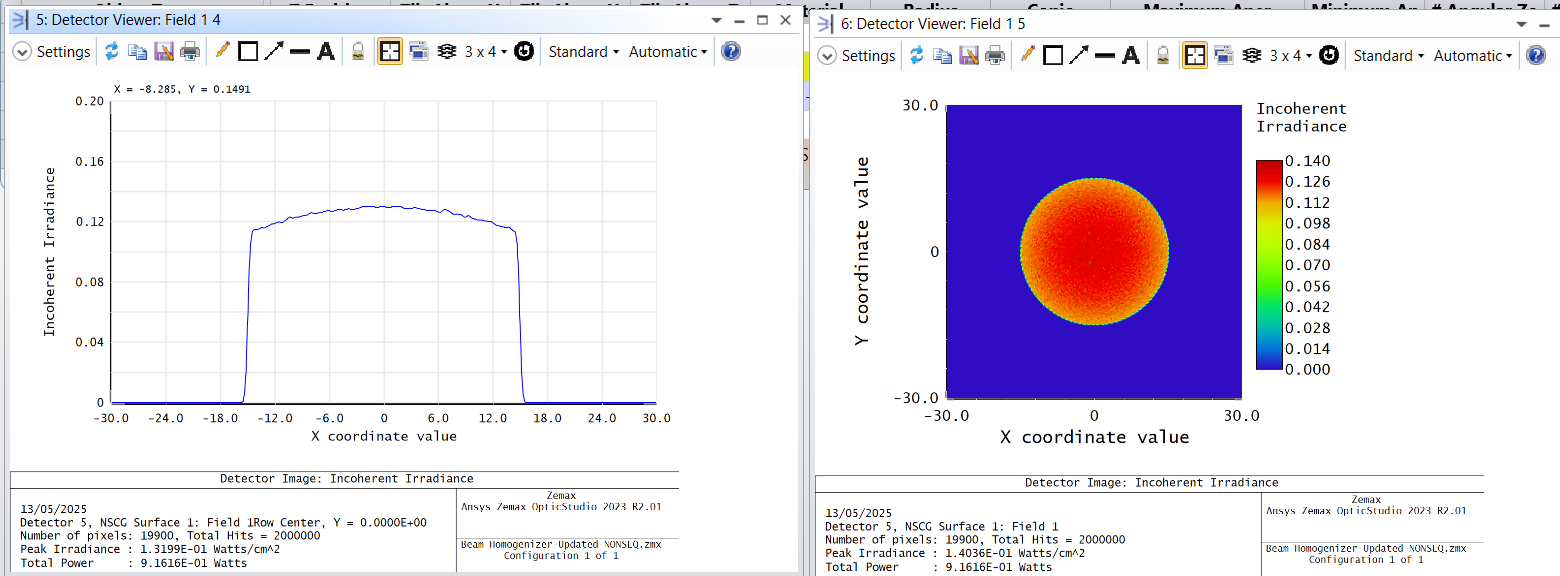
The incoherent intensity of the ray. This energy is stored by incrementing the counter corresponding to the pixel the ray struck. The sum of the ray intensity divided by the pixel area yields the irradiance in flux per area.
The incoherent intensity of the ray in angular space. This energy is stored by incrementing the counter corresponding to the pixel the ray struck in angle space. The sum of the ray intensity divided by the solid angle the pixel represents yields the intensity in flux per solid angle.
For the purposes of binning energy into angle space pixels, OpticStudio computes the X and Y angles from polar coordinates. The polar coordinates are defined in the following way:
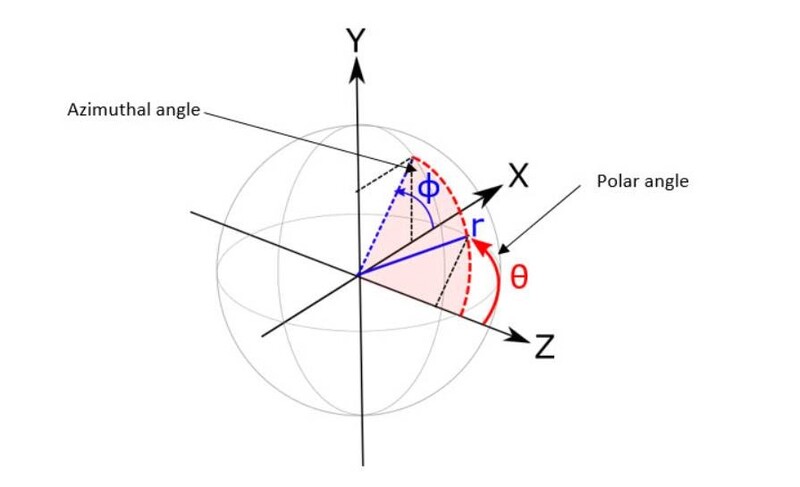
The radial angle of the ray is measured with respect to the object's local z-axis, and is then projected onto the object's local XY-plane to compute the X and Y angles. The calculation of the X and Y angles, in degrees, is shown below:
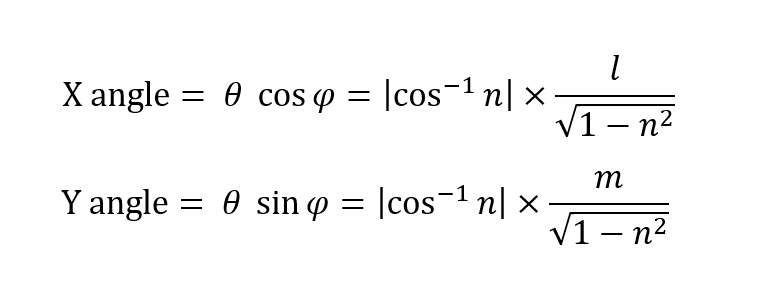
where l, m, and n are the direction cosines of the incident ray relative to the detector's local coordinate.
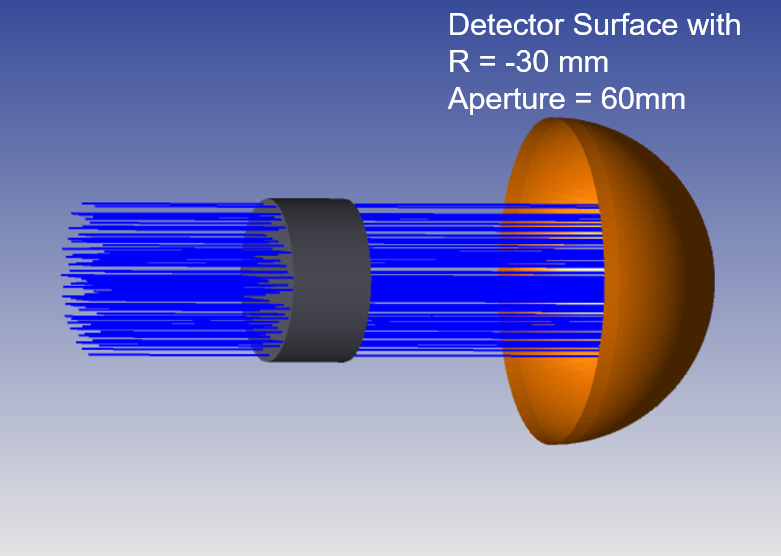
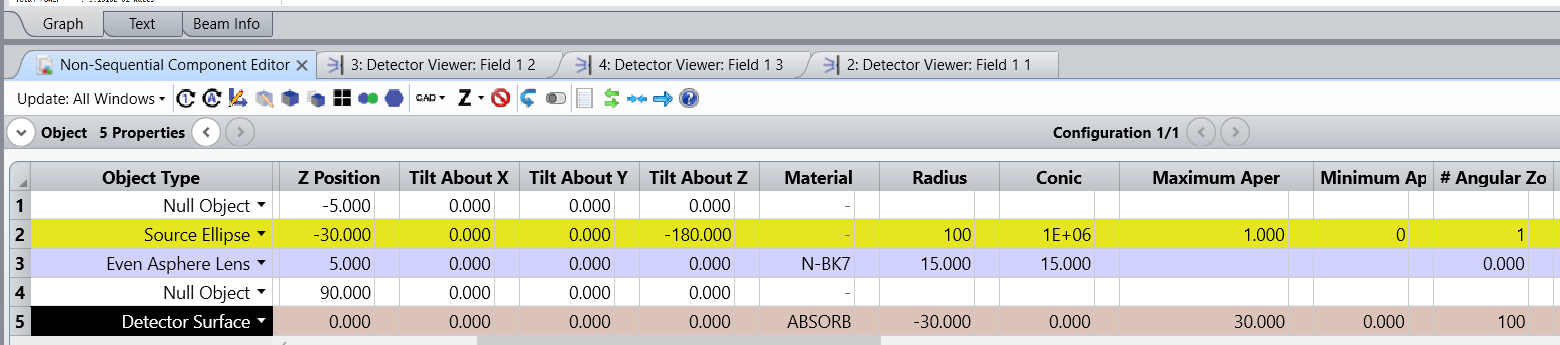
Detector Surface Object:
In the curved detector surface object, it uses a different method to compute the detector ray data. The help file link for the same is Detector Surface Object.
One data item is stored for every ray that strikes the detector: The incoherent intensity of the ray. This energy is stored by incrementing the counter corresponding to the pixel the ray struck. The sum of the ray intensity divided by the pixel area yields the irradiance in flux per area.
OpticStudio uses a collection of triangles to conform to the shape of the curved surface. There are Nr radial zones, and Na angular zones. Together these two parameters define Nr * Na polygonal regions. Each region is generally divided into two triangles, so the total number of triangular pixels is 2 * Nr * Na. However, if the minimum aperture (parameter 4 above) is zero, then the innermost radial zone has only Na triangles rather than 2 * Na. In this case the total number of triangles is 2 * Nr * Na - Na. The algorithm that selects the triangle coordinates attempts to make the area of each triangle approximately the same, however the area from triangle to triangle can not be held exactly constant. The corners of each triangle will lie on the aspheric surface defined by the radius, conic, and aspheric coefficients. The triangles are flat and do not lie exactly on the surface if the surface is not flat.
As per my understanding, I am sharing the sample picture, which is just an example for visualization reference.
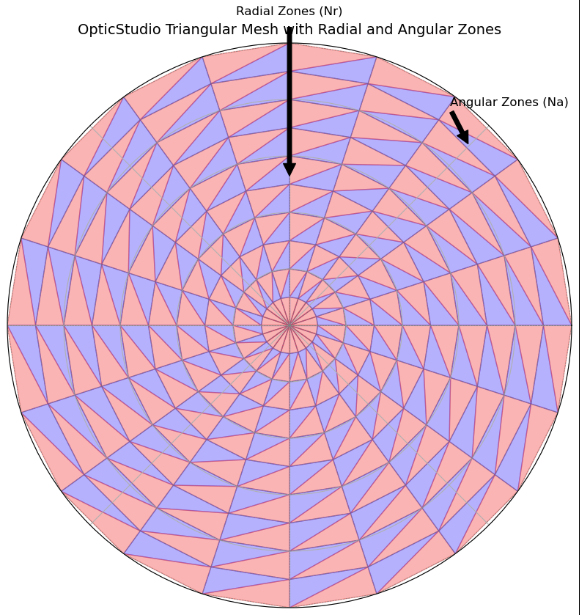
- Radial Zones (Nr): The surface is divided into concentric rings.
- Angular Zones (Na): Each ring is further divided into angular slices.
The triangles are the individual pixels used to record irradiance and flux data. The pixels are numbered in consecutive radial zones. Pixel 1 starts at angle zero in the innermost radial zone. The first 2 * Na pixels (or just Na pixels if the minimum aperture is zero) are numbered going counter clockwise around z to complete the first annular zone. The pixel numbering continues at angle zero in the second radial zone for the next 2 * Na pixels, until all radial zones are complete.
Detector Surface objects use a collection of triangles to approximate a curved surface that can detect flux and irradiance. The display of the detected data requires conversion of the triangles into square pixels. This conversion is done automatically when displaying the detector data as a false color, grey scale, or cross section plot. The number of square pixels selected is adjusted to provide a reasonable display resolution, and will vary depending upon the number of triangles.
Question: I wish to simulate data as it will be seen on a radial screen in real life. So what would be the vest way to simulate this?
For this question, I would say that your approach is the right way to simulate. To achieve better accuracy, consider using more pixels or increasing the resolution of the detector surface, similar to the system specification you are simulating.
Please feel free to ask further questions you may have. We are happy to help you.
Best Regards,
Prasath R