TAGGED: deformation, mechanical-apdl, plots, xy-plot
-
-
July 20, 2021 at 9:36 am
MCK_Pandaleon
SubscriberHello,
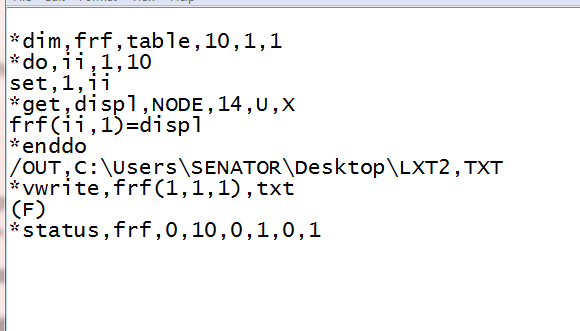
I would like to create an APDL command that would create a table with 33rows, 14 columns and 1 plane that would store node "location" once on the first line; and for every time step add a new row of values of deformation amplitude at each node with the corresponding time at the begining of each line .
This table would allow me to plot deformation amplitude vs length at any given step.
However I have not been able to do so, the (1,1) spot would be assigned the value 0 with '*set, data(1,1),0'.
I have created the table with '*dim,data,TABLE,33,14,1' and I wanted to fill it with '*vget' commands but I am not sure how to to this.
Any help is appreciated!
PS : the model is in 2D with an axi-symmetry defined around the Y axis. The deformation is also along the Y axis.
July 20, 2021 at 10:21 pmJuly 22, 2021 at 4:02 pmGovindan Nagappan
Ansys EmployeeIt would help if you could show a sample data that you want to export by inserting an image. What data goes into the 33 rows and what data goes in each column?
Here are some sample commands that you can use. See if you can modify this for your needs
*dim,narray,array,33,14 ! define a matrix
*dim,node_vmask,array,ncount!define mask vector ncount is node count. You can use *get command to retrieve that
!select the nodes for which you need the result
*vget,node_vmask(1),node,,nsel
nsel,s,node,,1,ncount
*vmask,node_vmask(1)
*vget,narray(1,1),node,,nlist !column 1 has node list
*vget,narray(1,2),node,,loc,x !column 2 has node location X
*do,i,1,tset !use *do loop to retrieve uy at all result sets. tset is total time set. you will need a *get to retrieve that value
set,,,,,,,i
*vmask,node_vmask(1)
*vget,narray(1,i+2),node,,u,y !get Y direction displacement
*enddo
*vmask,node_vmask(1)
*mwrite,narray,my_output,txt!writes out a 2D matrix
(F10.0,TL1,13(F20.8))
July 23, 2021 at 11:06 amMCK_Pandaleon
SubscriberHello !
Thank's for the code lines.
Basically I am running harmonic responses and plotting the directional deformation along a set path. I have found that plotting length vs deformation when the path is defined with construction geometry is and automatic. However I would like to be able to access this plot for each time in the "deformation cycle", right now it plots deformation vs length at a random time and I can't figure out how to select it at a different time. (I believe we have access to this information with harmonic response because you can visualise a full cycle on ANSYS by playing the animation ).
I am not sure if this is a clear explanation.
 The top row would be for the "time", the left column would stock the length (I'd actually need 34 rows ), and in the other rows you'd have the amplitude of the deformation at the corresponding length on the path depending on the time at which it is measured.
Do you understand what I mean?
July 23, 2021 at 11:43 amViewing 4 reply threads- The topic ‘Create a Table with time, deformation amplitude and node location (length)’ is closed to new replies.
Innovation SpaceTrending discussionsTop Contributors-
5069
-
1771
-
1387
-
1248
-
1021
Top Rated Tags© 2026 Copyright ANSYS, Inc. All rights reserved.
Ansys does not support the usage of unauthorized Ansys software. Please visit www.ansys.com to obtain an official distribution.
-


