-
-
February 15, 2023 at 11:18 am
henrique.geraissate
SubscriberHi everyone,
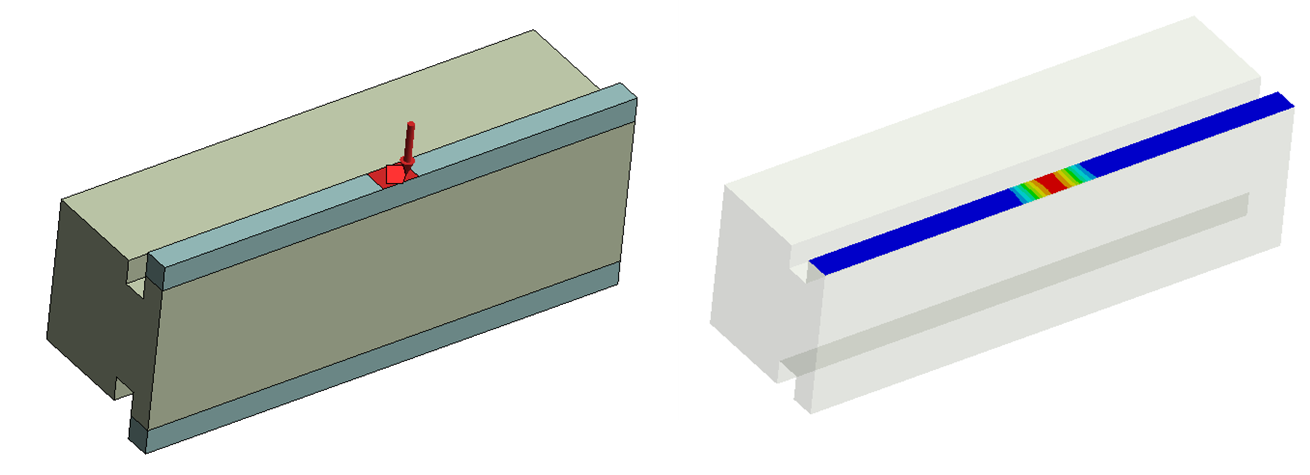
I have two parts pressed against each other with frictional contact between them. The pressure is applied only in some specific areas from one of the parts, and I want to evaluate how is the pressure distribution in the contact surface.
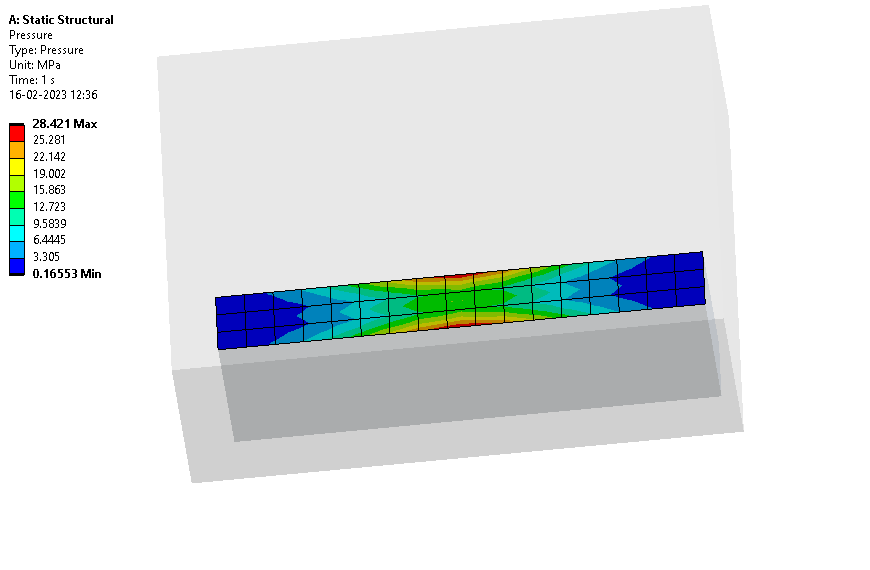
I could easily obtain the result above by inserting a contact tool scoped to the face of interest. But I would like to have a linear plot along the longitudinal direction of this face, to evaluate for example the decrease of the pressure from the center to the edges.
So basically I would like to scope this pressure result to a Path, but I could not find that option. Is this even possible?A workaround it would be plotting the the normal stress on that surface and scoping it to the path, but that's not exactly the contact pressure, right?
Any inputs?
Thanks,
Henrique -
February 16, 2023 at 7:09 am
Akshay Maniyar
Ansys EmployeeHi henriquegpo,
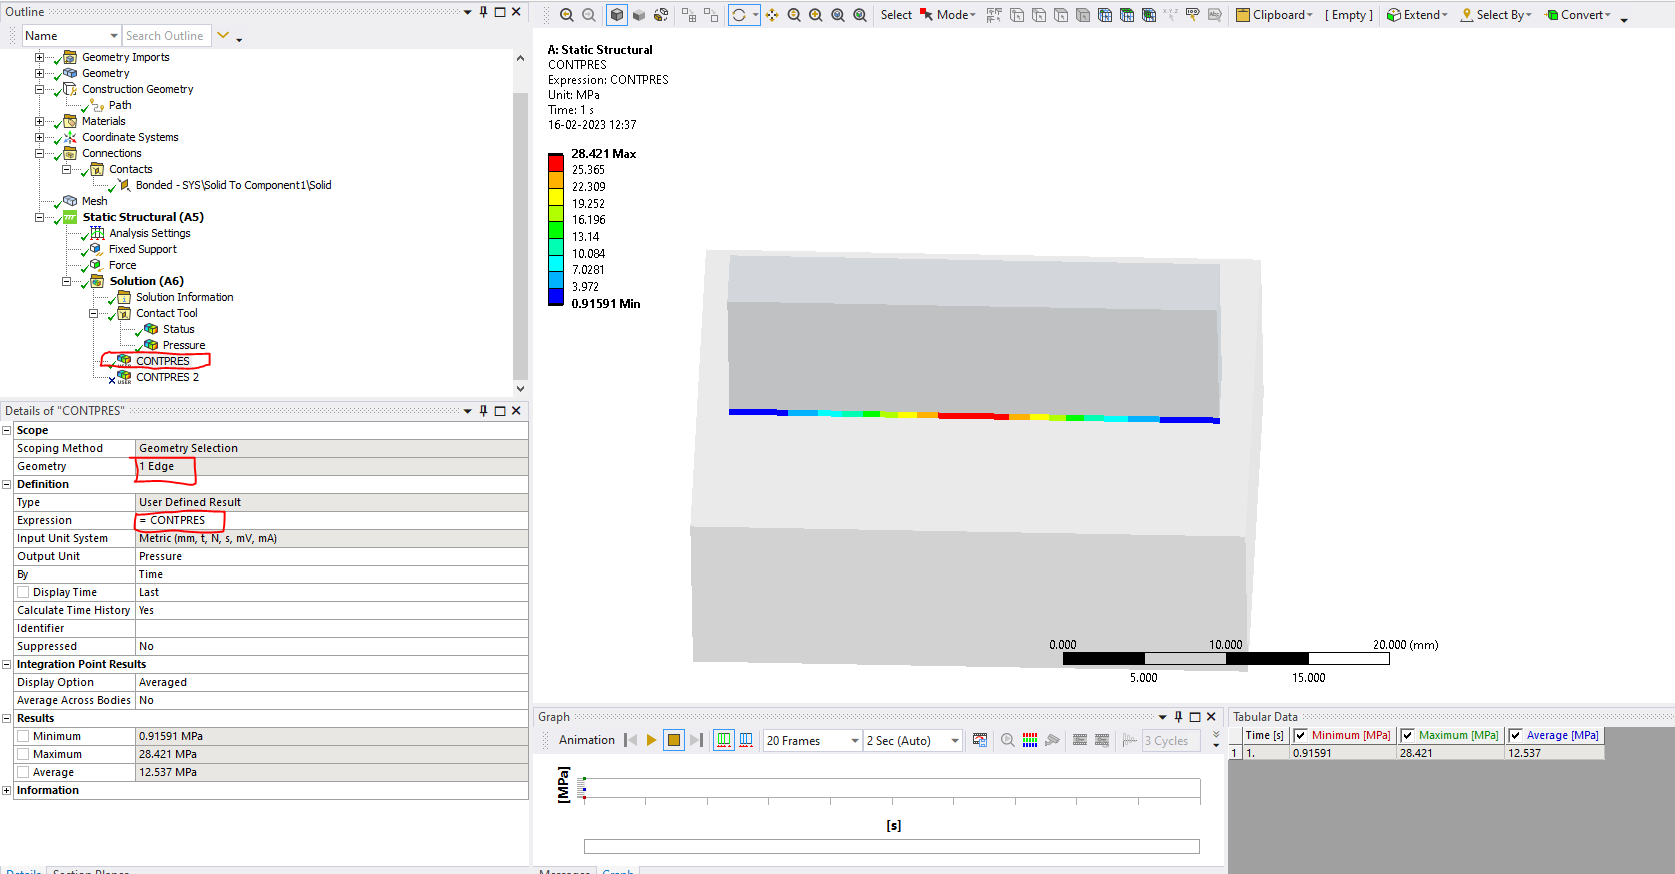
Have you tried to plot the CONTPRES user defined result and selected the geometry as longitudinal edge? I tried it on simple model and it gives me contact pressure along that edge. First image shows the contact pressure plot for the contact region and second image shows the CONTPRES result across the edge.
Thank you,
Akshay Maniyar
How to access Ansys help links
Guidelines for Posting on Ansys Learning Forum
-
February 16, 2023 at 12:42 pm
henrique.geraissate
SubscriberHello Akshay, thanks for the response!
This option does work, but it’s still not exactly what I need. I would like to define a longitudinal path in the center of the contacting surface, and get the result along that path. I could split the face in two, use both in the contact definition and then scope the CONTPRES result to the central edge, but that way it is still not possible to get the chart Position x Pressure that I want. Creating a path on the edge also does not help. Apparently it is not possible to scope CONTPRES to a path (or at leat I could not manage to do so).
The workaround I am doing now is exporting a txt file for the whole contact surface, and then in Excel I filter the data to get the central nodes results only. That works, but it is quite tedious, prone to error and could be very demanding depending on how many scenarios I would like to compare. Also, it depend on having a mapped/structured mesh on the face of interest, which is not always possible.
So in case you have another suggestion, I would be pleased to hear it.
Thanks,
Henrique -
February 21, 2023 at 8:24 am
Akshay Maniyar
Ansys EmployeeHi henriquegpo,
There is no direct way to plot the contact pressure * position in mechanical. I guess, the workaround you are using is good. But instead of exporting contact pressure results for the whole surface, you can export for the required edge(path is not supported). So that you will have results only for the required nodes. Also, use LOCX( or LOCY or LOCZ as per the direction) user-defined result to get the position of nodes on the same edge selected for contact pressure. You can use multi object export ACT to export contact pressure and LOCX results to export them together and then use excel to plot the graph.
https://catalog.ansys.com/product/5b3bc6857a2f9a5c90d32e7f/multi-object-expor
Thank you,
Akshay Maniyar
How to access Ansys help links
Guidelines for Posting on Ansys Learning Forum
-
- The topic ‘Contact Pressure result scoped to a Path’ is closed to new replies.


-
5094
-
1831
-
1387
-
1248
-
1021

© 2026 Copyright ANSYS, Inc. All rights reserved.


