-
-
June 28, 2018 at 5:13 am
-
June 28, 2018 at 8:22 am
Aniket
Forum ModeratorFrom Mechanial>Tools>Options>Mechanical>Export>Text File Export>Include Node Location>Yes
And then, right click on the result in the tree> Export> Export text file
This will export the result in excel file with the original node locations
-
June 28, 2018 at 12:42 pm
peteroznewman
SubscriberAniket, I think Subrat wants the coordinates of the isoline of stress. I haven't tried your suggestion, but expect that is not what is output.
Subrat, I would use a digitizing program (inside matlab, I use Grabit) and manually click on the isoline. If you change the plot style from filled to Isoline, you can have an actual line, and you can reduce the number of bands to just a few and if you turn off element edges, those will not interfere with the digitizing. You can use symmetry and digitize only to the top half.
You should also reduce your mesh size as I expect the isoline will move a little as the elements get smaller. I can see some mesh dependence in the isoline with the current element size.
-
July 1, 2018 at 12:27 am
peteroznewman
SubscriberSubrat,
I made a similar model to yours but with a finer mesh and made this Isoline plot
I followed Aniket's instructions and exported the stress data, and as I expected, ANSYS wrote the stress at each node, along with the x,y,z coordinates.
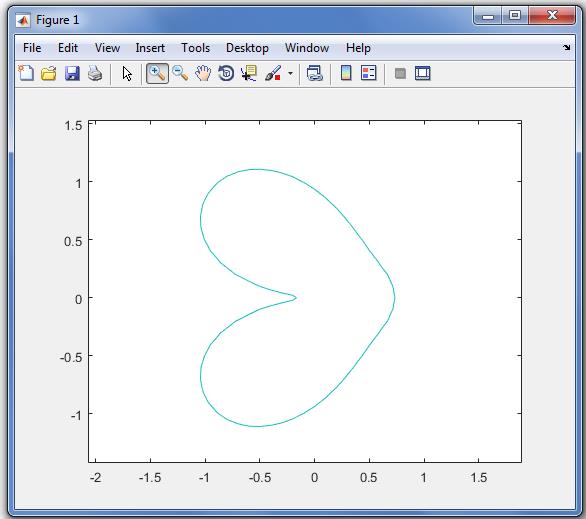
If you have matlab, you can import this data and with a few lines of matlab code, a grid of interpolated values can be created, then the matlab contour command can draw that same isoline that ANSYS plotted above.
But matlab will list the x,y coordinates of this isoline, which is exactly what you wanted!
I don't understand why you wanted that, so if you care to explain, that would be interesting.
-
July 1, 2018 at 10:04 am
subrat0403
SubscriberI want to extract the gauss point data and plot the curve. Is it possible?
-
July 1, 2018 at 3:08 pm
peteroznewman
SubscriberIf I use the linear PLANE182 elements with Keyop(1)=1, then there is only 1 Gauss point per element. In that case I can plot the element mean stress in the results setting.
Then each element has a single value of stress. But a node is shared by four elements so does it have four values? This is why FEA results are usually averaged, so there is a single value at the node and the stress varies across the element according to its shape function.
In the image below, the elements change color at the 500 and 1000 MPa levels.
What do you want to do now that you have stress at the Gauss points? Do you want to output the coordinates of the center of the element?
You didn't say why you wanted the x,y coordinates of the isoline. Can you say why you want Gauss point data and not nodal average data?
-
July 2, 2018 at 3:51 pm
subrat0403
SubscriberSir are you working on fracture mechanics? I have some doubts regarding evaluation of J integral. I need your help. Can we chat in F.B ?
-
July 2, 2018 at 5:29 pm
peteroznewman
SubscriberI have used the Fracture tool in ANSYS, but I am not an expert on J integral. I recommend you describe your doubts in a new discussion in the Structural Mechanics section and you may get some good answers.
-
November 26, 2023 at 6:44 am
MuhammadAhsanZeeshan
SubscriberHello Everyone,
I made surface along my local coordinate at my 3d model in ANSYS workbench 2022 R1. I want to export normal stress data in my local coordinate. when i export normal stress data, it will obtain along global coordinate. But I want normal stress exported data in local x, y and z coordinates not along global coordinate.
-
- The topic ‘Co-ordinate of a point in result plot’ is closed to new replies.


-
4633
-
1535
-
1386
-
1225
-
1021

© 2025 Copyright ANSYS, Inc. All rights reserved.


