TAGGED: non-linear-material
-
-
October 27, 2021 at 4:50 am
karthikeyan.m
SubscriberIm using Ramberg Osgood equation for obtaining the stress strain input data. For this i assume that the yield stress is occuring at 0.2% of plastic strain.
But i cannot input the 0.2% strain in the first row of strain strain tabular data in ansys. Because we have to enter the first row as 0, Yield Stress.
So i worried that changing the first point to the 0, yield stress will deviate my ramberg osgood stress strain curve data.
October 27, 2021 at 11:53 amAniket
Forum ModeratorPlastic strain in the column would be Total strain-Elastic strain, so at yield point you will have zero plastic strain.
-Aniket
How to access Ansys help links
Guidelines for Posting on Ansys Learning Forum
October 27, 2021 at 12:39 pmkarthikeyan.m
SubscriberHi Aniket,
Thanks for your reply.
I agree your point. We have to input the true Plastic strain data for each true stress values. And first row would be 0(Plastic Strain), Yield stress.
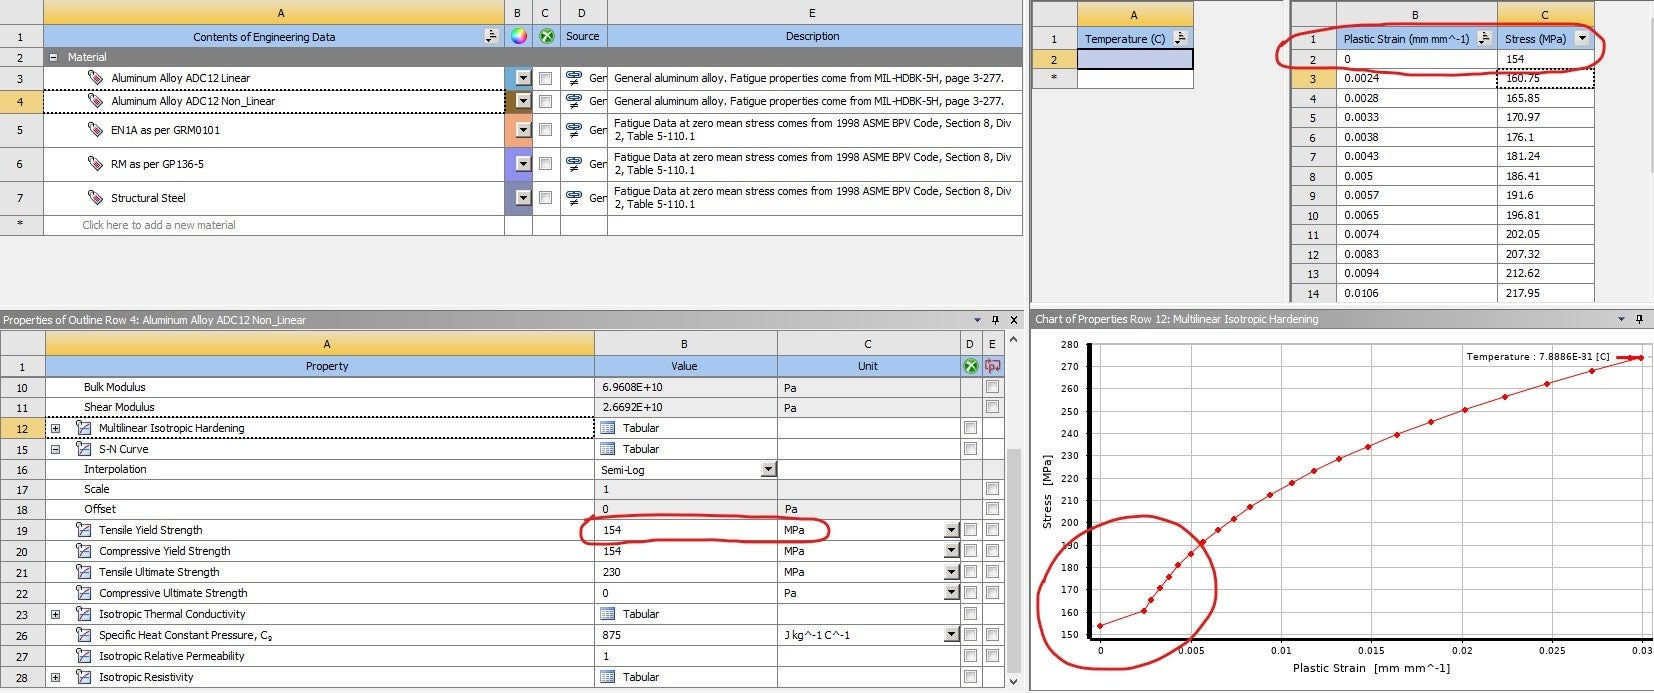
But for some metals, finding the yield point is not easy. So generally they consider the yield point as the stress level which cause 0.2% plastic strain. It is also called as proof stress.(Refer Image below)
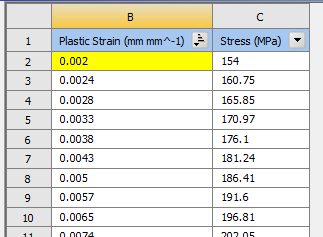
 So considering this situation, we have to enter the True Plastic strain and True stress values as mentioned below.
 But ansys will not allow us to enter the stating point other than 0 for the yield point(154MPa). (the yellow field is highlighted by the ansys which indicates the input error).
So if i want to input the exact stress strain curve by considering the 0.2% Proof stress as a yield stress, what is the correct way to input the Plastic strain-Stress data?
October 27, 2021 at 1:29 pmAniket
Forum Moderatorsimply subtract 0.002 from each row for the first column.
-Aniket
How to access Ansys help links
Guidelines for Posting on Ansys Learning Forum
October 27, 2021 at 2:06 pmkarthikeyan.m
SubscriberYes, I tried this also. But subtracting 0.002 from each row will not match the material stress strain curve.

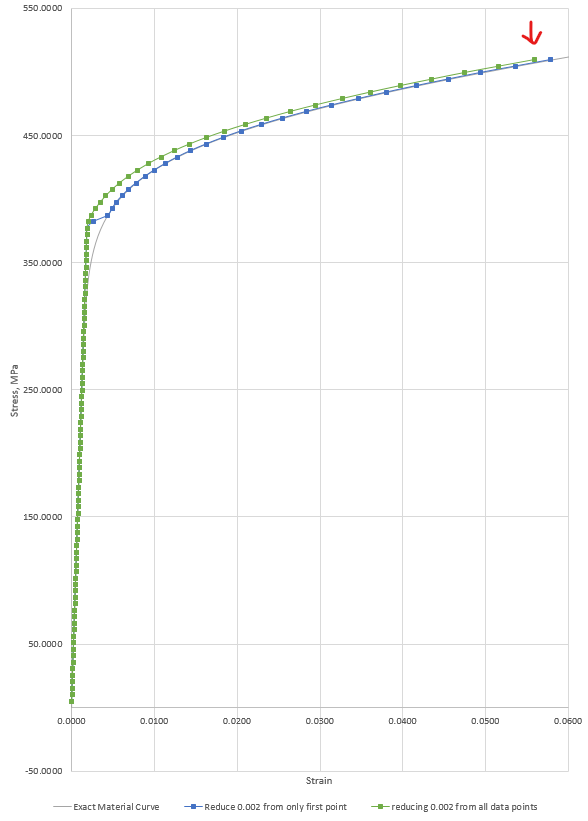
In the above image, ash colour line is the exact material curve. If i reduce 0.002 from all the strain points, the behaviour does not matches with the exact material curve. (Compare green and ash colour line). Here strain values and stress values are not matching with the exact material curve.
And if i reduce 0.002 from only first point, the behaviour is not matching at the yield point.(compare blue and ash colour line)
So how to input the plastic strain and Stress data without compromising the exact material stress strain curve?
November 12, 2021 at 4:56 amkarthikeyan.m
SubscriberCan anyone please comment for the above query?
November 15, 2021 at 5:12 amkarthikeyan.m
SubscriberAnyone please help for the above query or suggest any answers for this.
November 16, 2021 at 1:53 pmVigneswaran Sridharan
Ansys EmployeeHi I suggest you look into this MAPDL reference.
2.2. Material Model Combinations Using Multilinear Isotropic Hardening (ansys.com)
Try inserting the MAPDL codes as a snippet in Mechanical once you figure out the appropriate command for your Material model.
Vigneswaran
November 16, 2021 at 2:04 pmAshish Khemka
Forum Moderator
Please see if the external tool below is of use. The stress-strain curve will be generated based on 0.2% yield.
P/A RambOs (p-over-a.co.uk)
Regards Ashish Khemka
May 25, 2022 at 4:29 ambriansun2018
SubscriberI think this paper got an answer:
https://www.researchgate.net/publication/290992225_On_Practical_Implementation_of_the_Ramberg-Osgood_Model_for_FE_Simulation
Viewing 9 reply threads- The topic ‘Clarification in stress strain curve input using Multilinear Isotropic Hardening’ is closed to new replies.
Innovation SpaceTrending discussionsTop Contributors-
4878
-
1587
-
1386
-
1242
-
1021
Top Rated Tags© 2026 Copyright ANSYS, Inc. All rights reserved.
Ansys does not support the usage of unauthorized Ansys software. Please visit www.ansys.com to obtain an official distribution.
-
The Ansys Learning Forum is a public forum. You are prohibited from providing (i) information that is confidential to You, your employer, or any third party, (ii) Personal Data or individually identifiable health information, (iii) any information that is U.S. Government Classified, Controlled Unclassified Information, International Traffic in Arms Regulators (ITAR) or Export Administration Regulators (EAR) controlled or otherwise have been determined by the United States Government or by a foreign government to require protection against unauthorized disclosure for reasons of national security, or (iv) topics or information restricted by the People's Republic of China data protection and privacy laws.


