TAGGED: Heat-solver, Lumerical-FDTD, photothermal, pitch, thermoplasmonics
-
-
October 1, 2021 at 2:59 pm
niazulkhan
SubscriberOctober 1, 2021 at 5:10 pmGuilin Sun
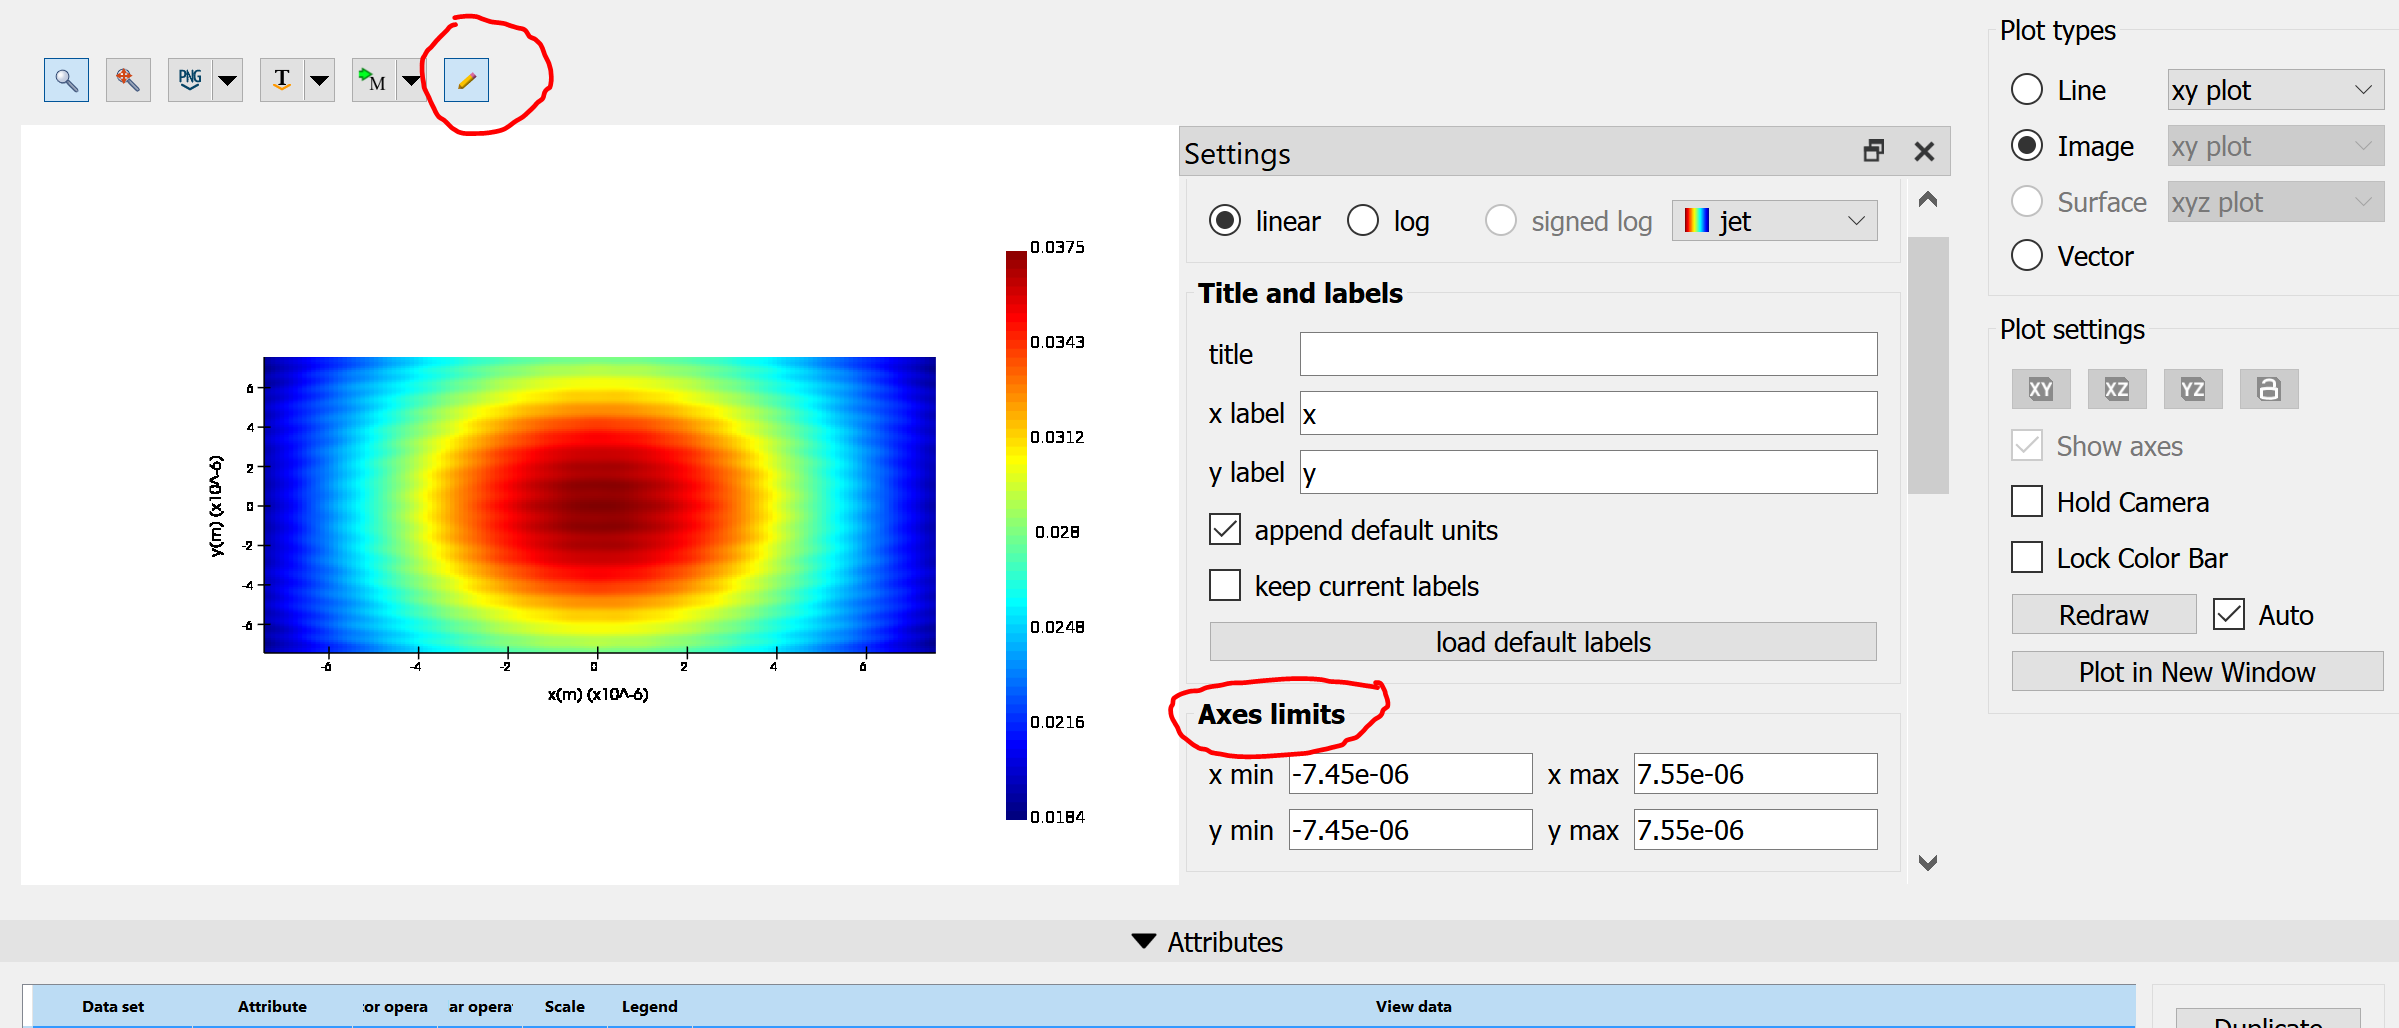
Ansys EmployeeThe visualizer shows the monitor data. Its largest size is determined by the monitor size. When you increased the pitch, did you change the monitor size at the same time to cover the whole simulation region? I usually suggest users to use larger monitors spans to be outside of the simulation region. So small change of FDTD region will not need to change the monitor.
BTW: you can only decrease the x-limit and y-limit from their largest values by editing the graph:
October 4, 2021 at 6:49 pmniazulkhan
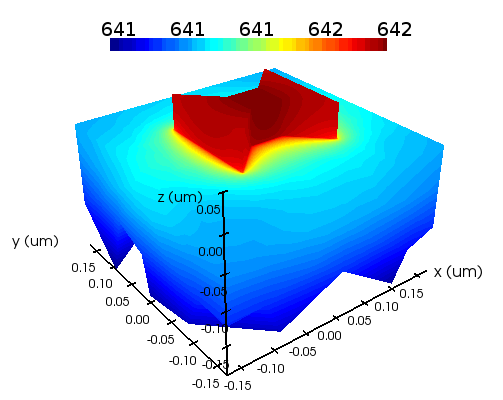
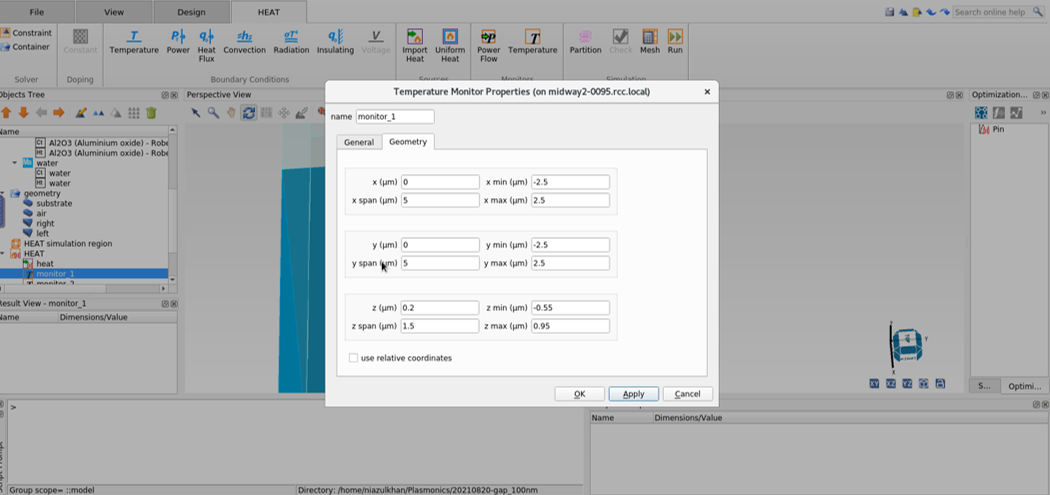
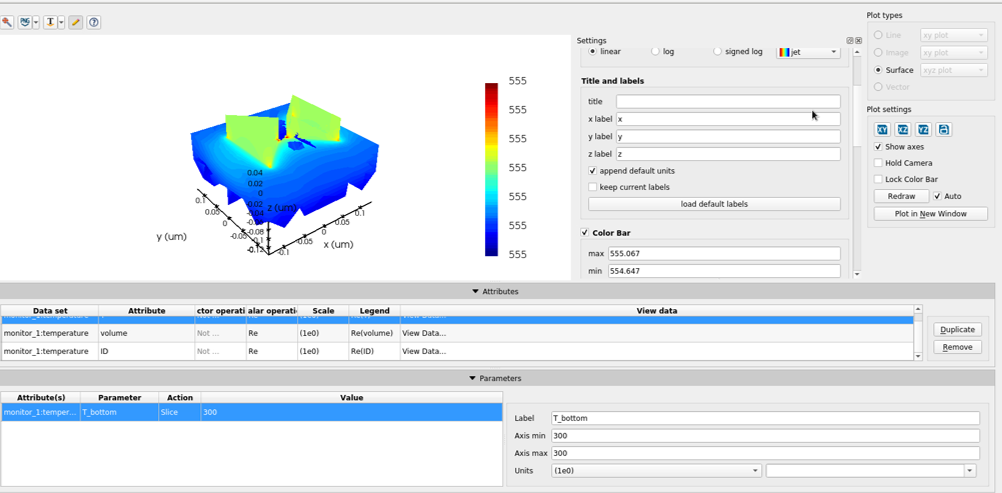
SubscriberThanks for your reply. I understand that largest size is determined by the monitor size. However, look at the attached images: though the monitor_1 size is 5um x 5um, the heat profile only shows 0.34 um x 0.34 um. I cannot change it by any means. I am not sure whether it is fixed by scripting at any place.
And also, look at the plot settings, there is no "Axes limits" option as yours.
October 6, 2021 at 11:26 pmGuilin Sun
Ansys EmployeeThe actual, useful size of the monitor is inside the simulation region. If the period is only 0.34um*0.34um, you will not be able to get any data outside of this range! Please check your simulation region.
October 7, 2021 at 1:51 amniazulkhan
SubscriberHello, Thanks a lot. but it does not help. I increased the simulation region to a dimension of 0.54 um x 0.54 um. and the heat profile always shows the same x- and y ranges. The monitor_1 size was 5um x 5 um. See the images below:
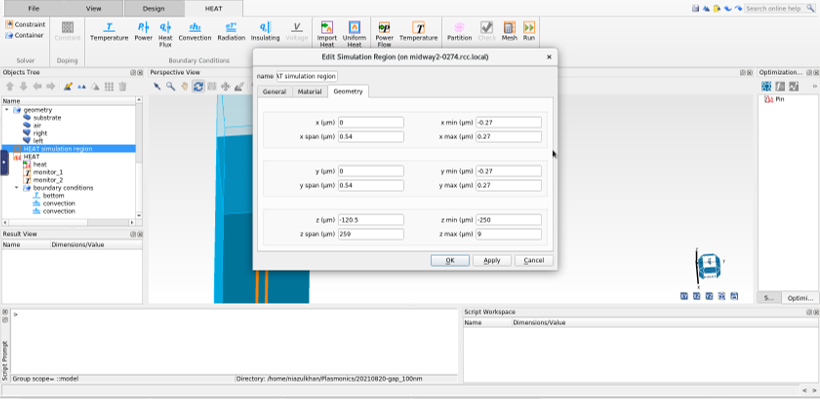
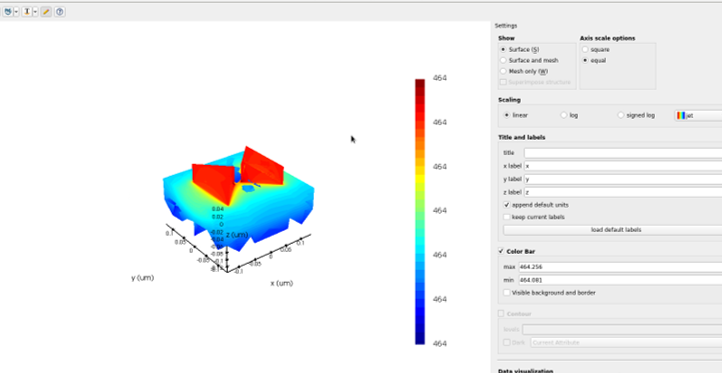
Though I can't change the X- and Y- range in any way, I can change the Z-ranges by simply tuning the monitor_1 size.
I would appreciate it if you could help me in this regard.
October 7, 2021 at 4:08 amGuilin Sun
Ansys EmployeeIt is originally from FDTD simulation with optical absorption. You will need to modify FDTD. Please follow the procedures in the example.
October 10, 2021 at 4:29 amniazulkhan
SubscriberI modified (increased) the FDTD geometry as well as the analysis group. When I do this, FDTD solver responds accurately as visible in the .mat file (Pabs_diabolo_array_1mW.mat) which contains the optical absorption data for the extended x-and y-axis range in the analysis group (Pabs_adv). However, the HEAT solver does not respond even after importing the .mat file. It seems that the axis limits froze and are unable to be changed.
October 18, 2021 at 2:39 pmOctober 19, 2021 at 2:01 amniazulkhan
SubscriberI did change both the FDTD and analysis group dimension as you highlighted above.
October 19, 2021 at 4:05 pmGuilin Sun
Ansys EmployeeThis is very strange. Please check the following:
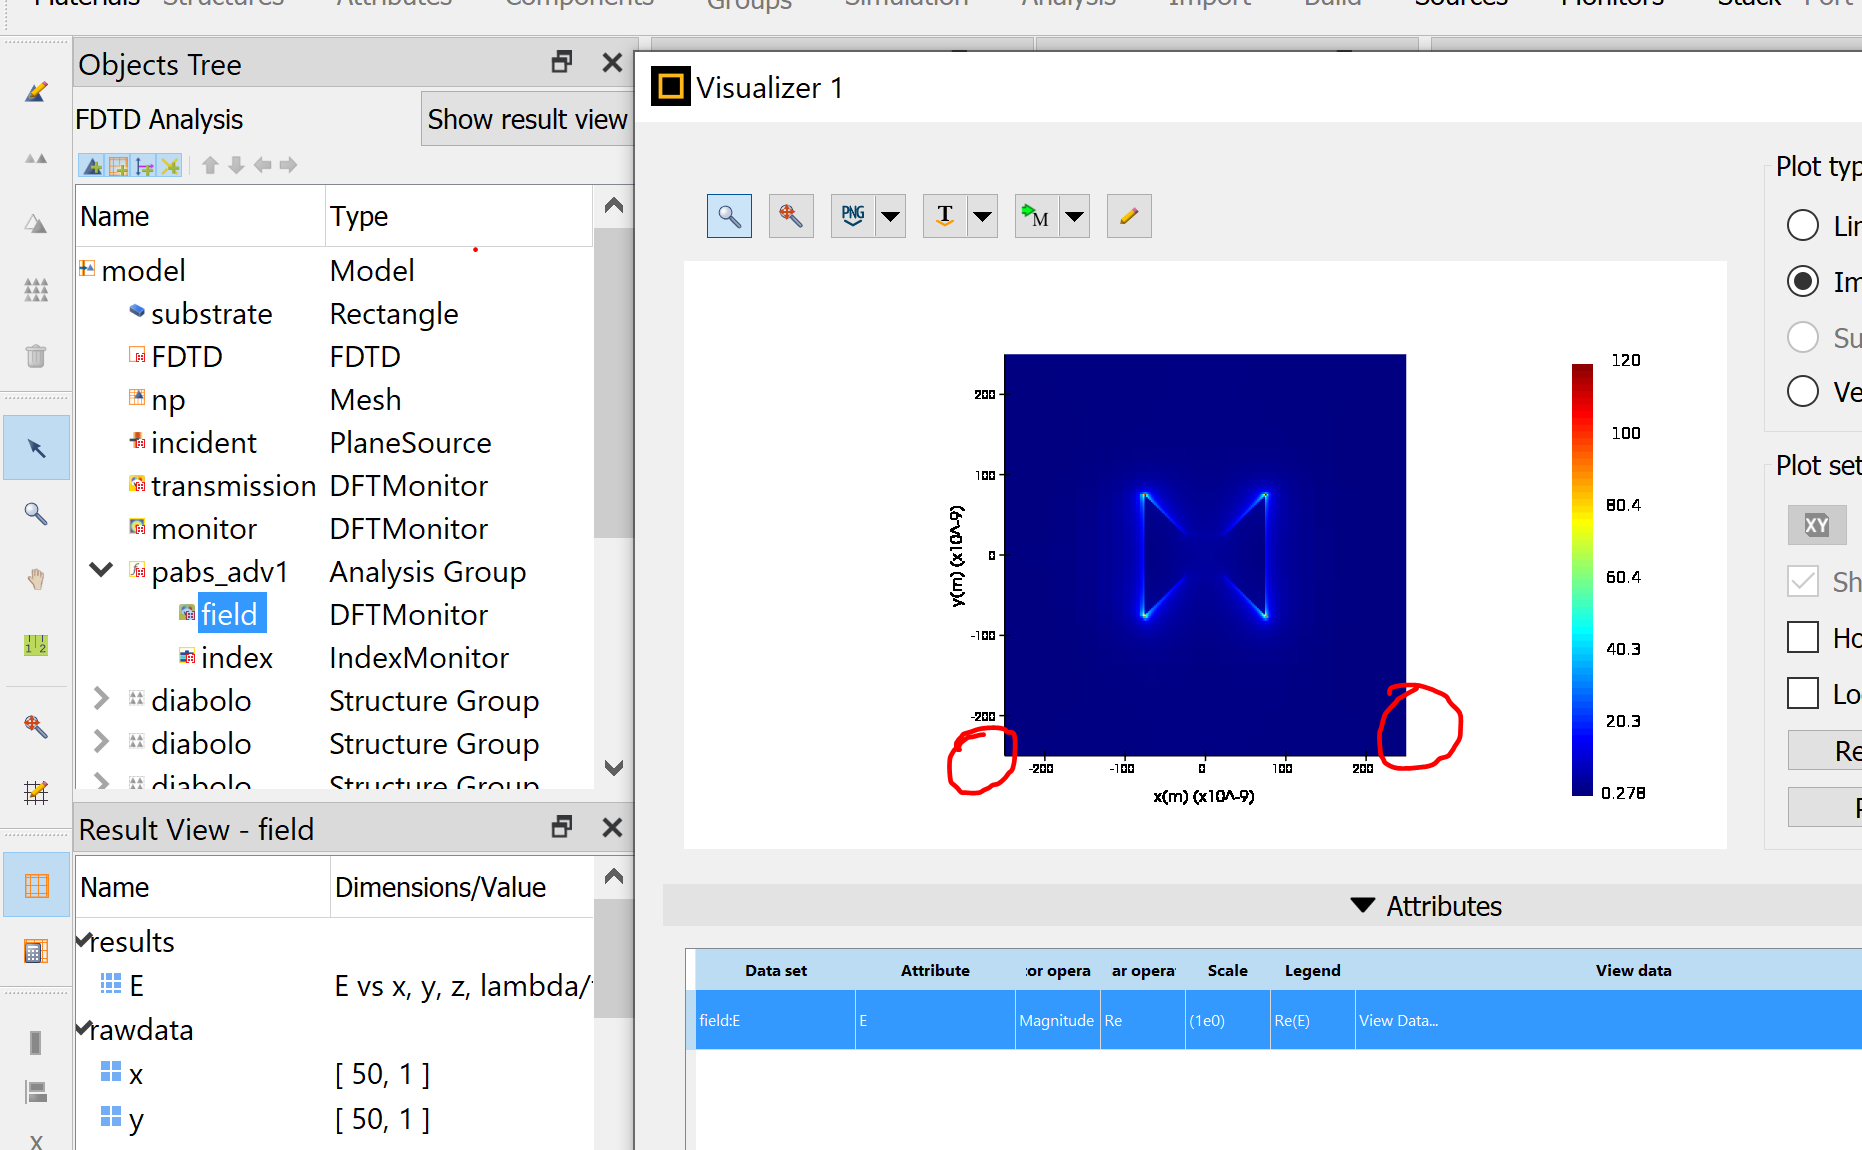
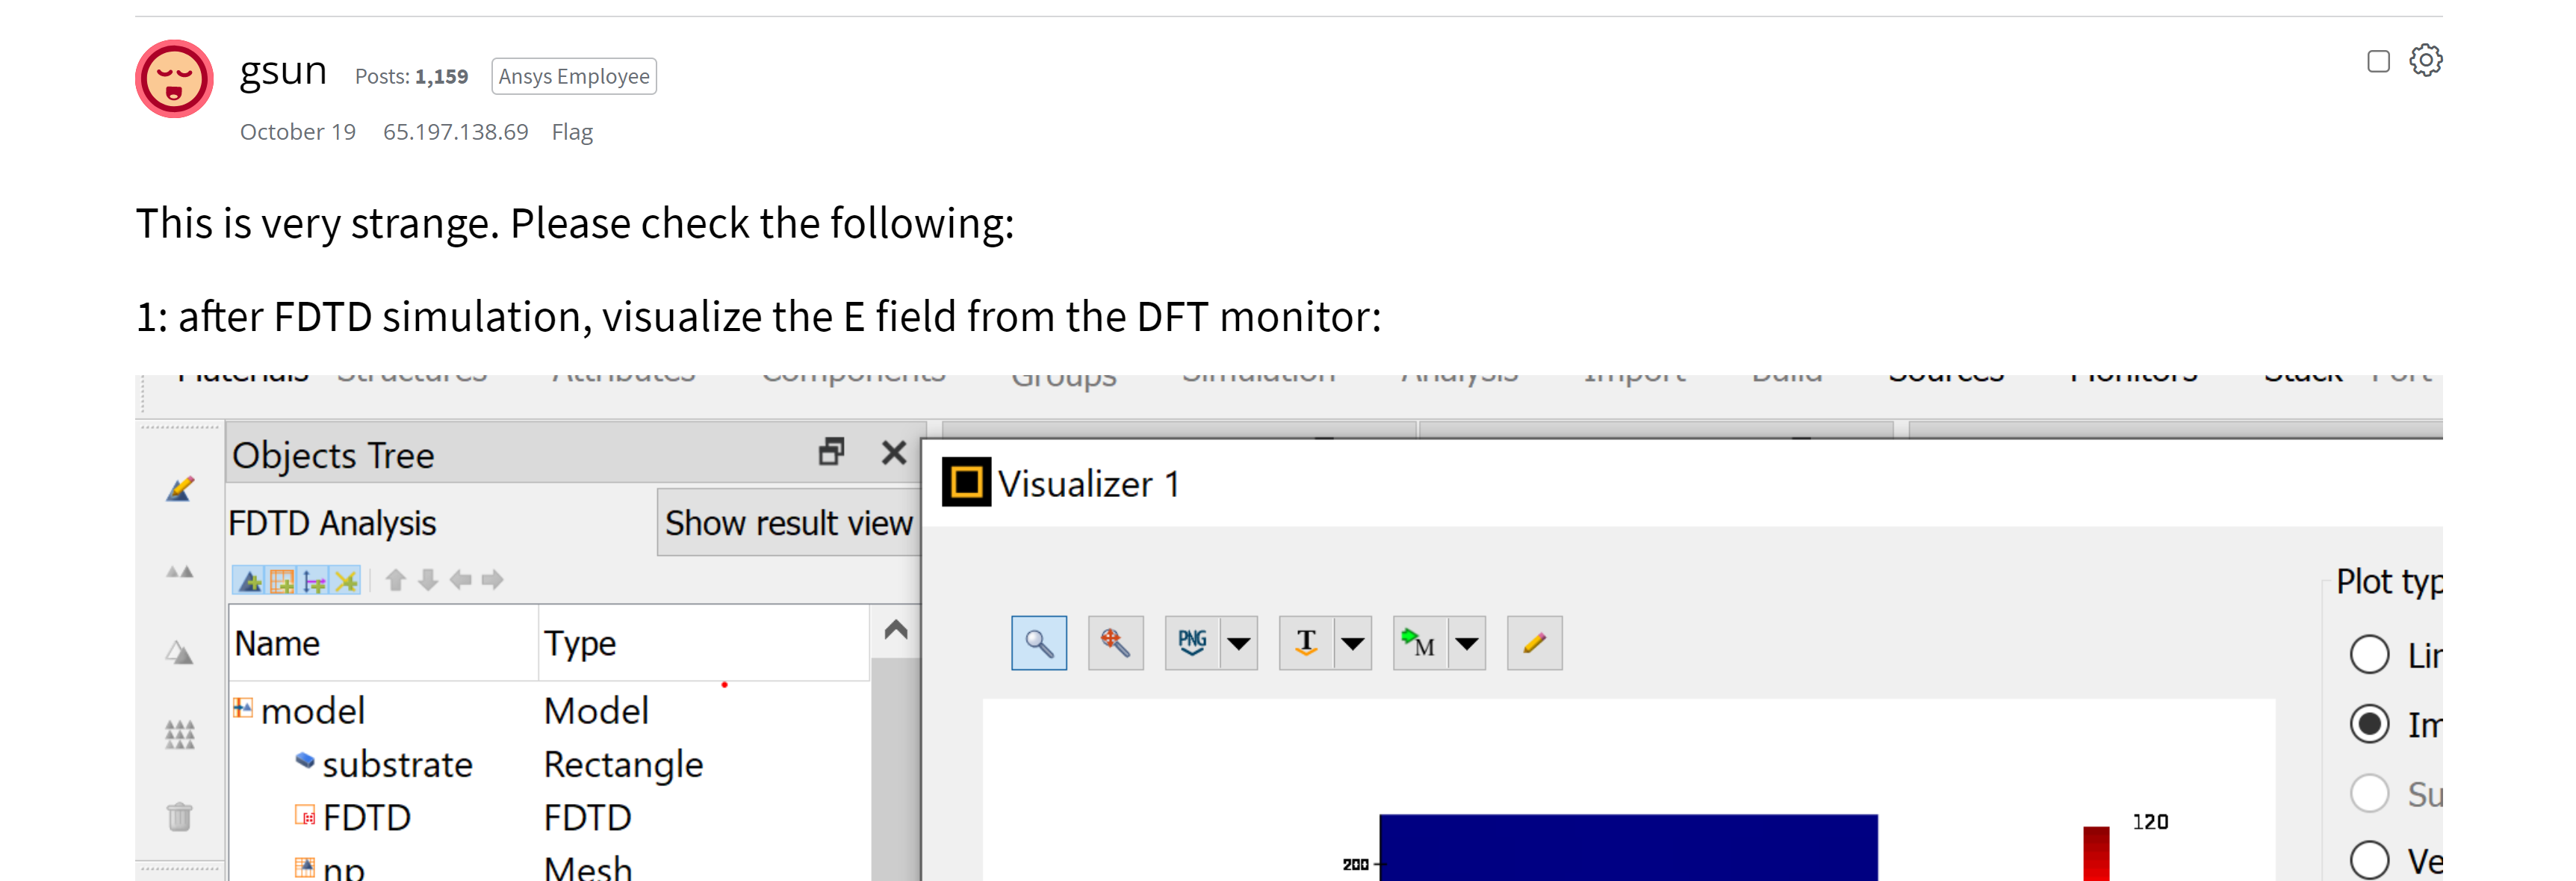
1: after FDTD simulation, visualize the E field from the DFT monitor:
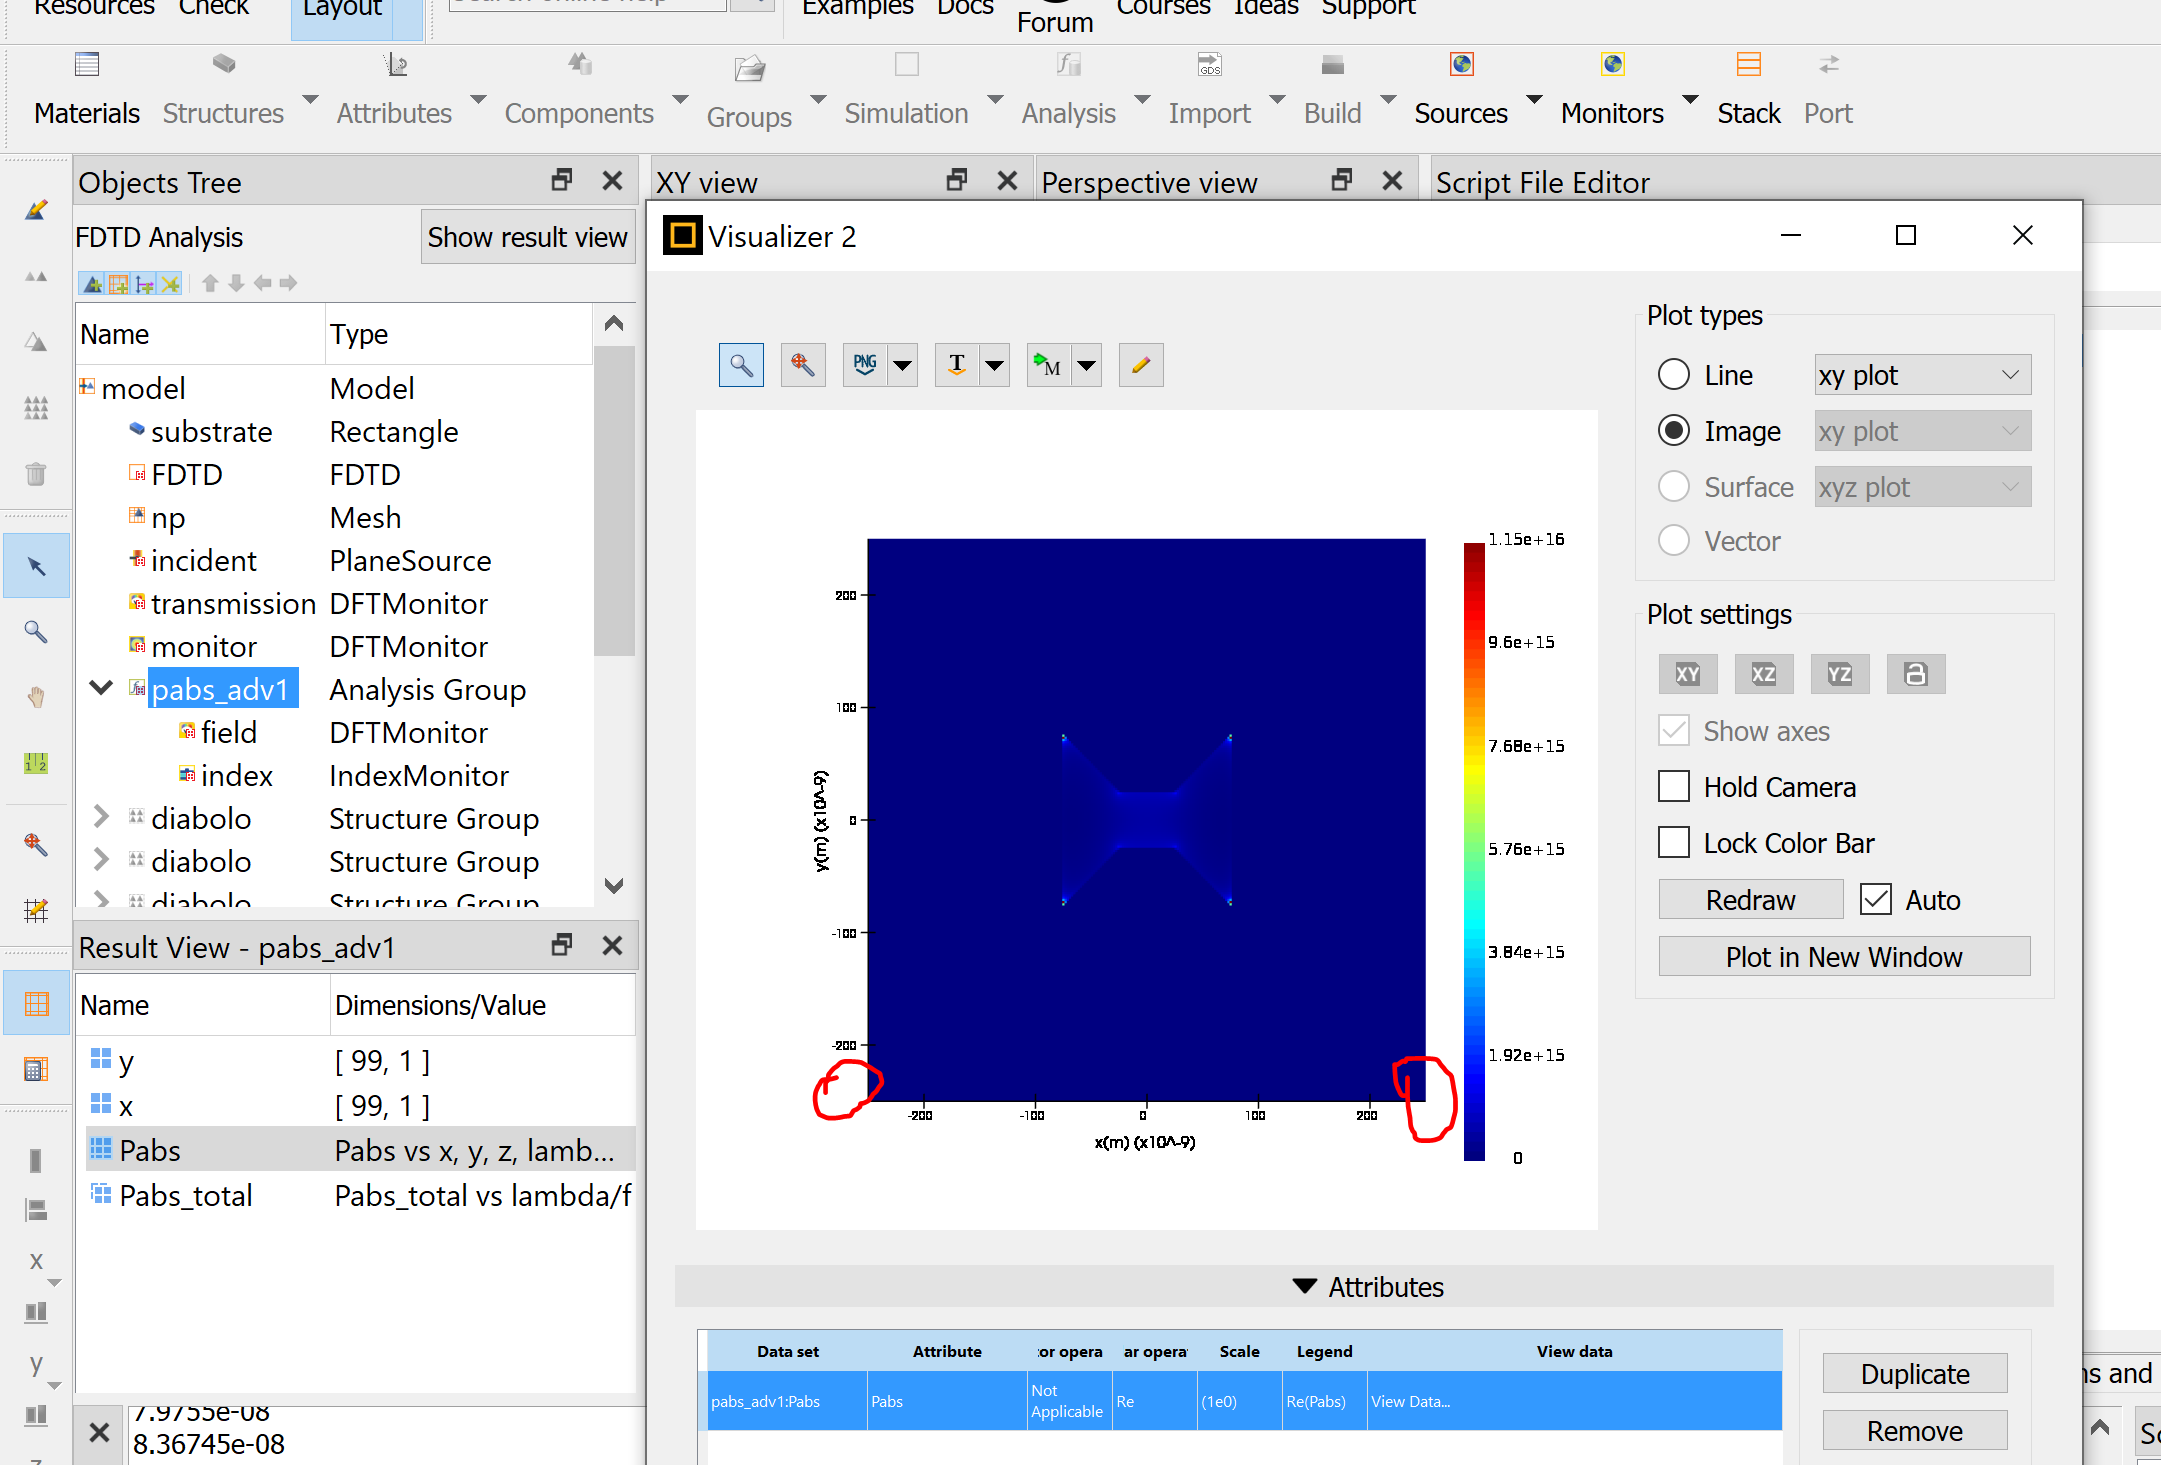
 2:runanalysis, and visualize the Pabs
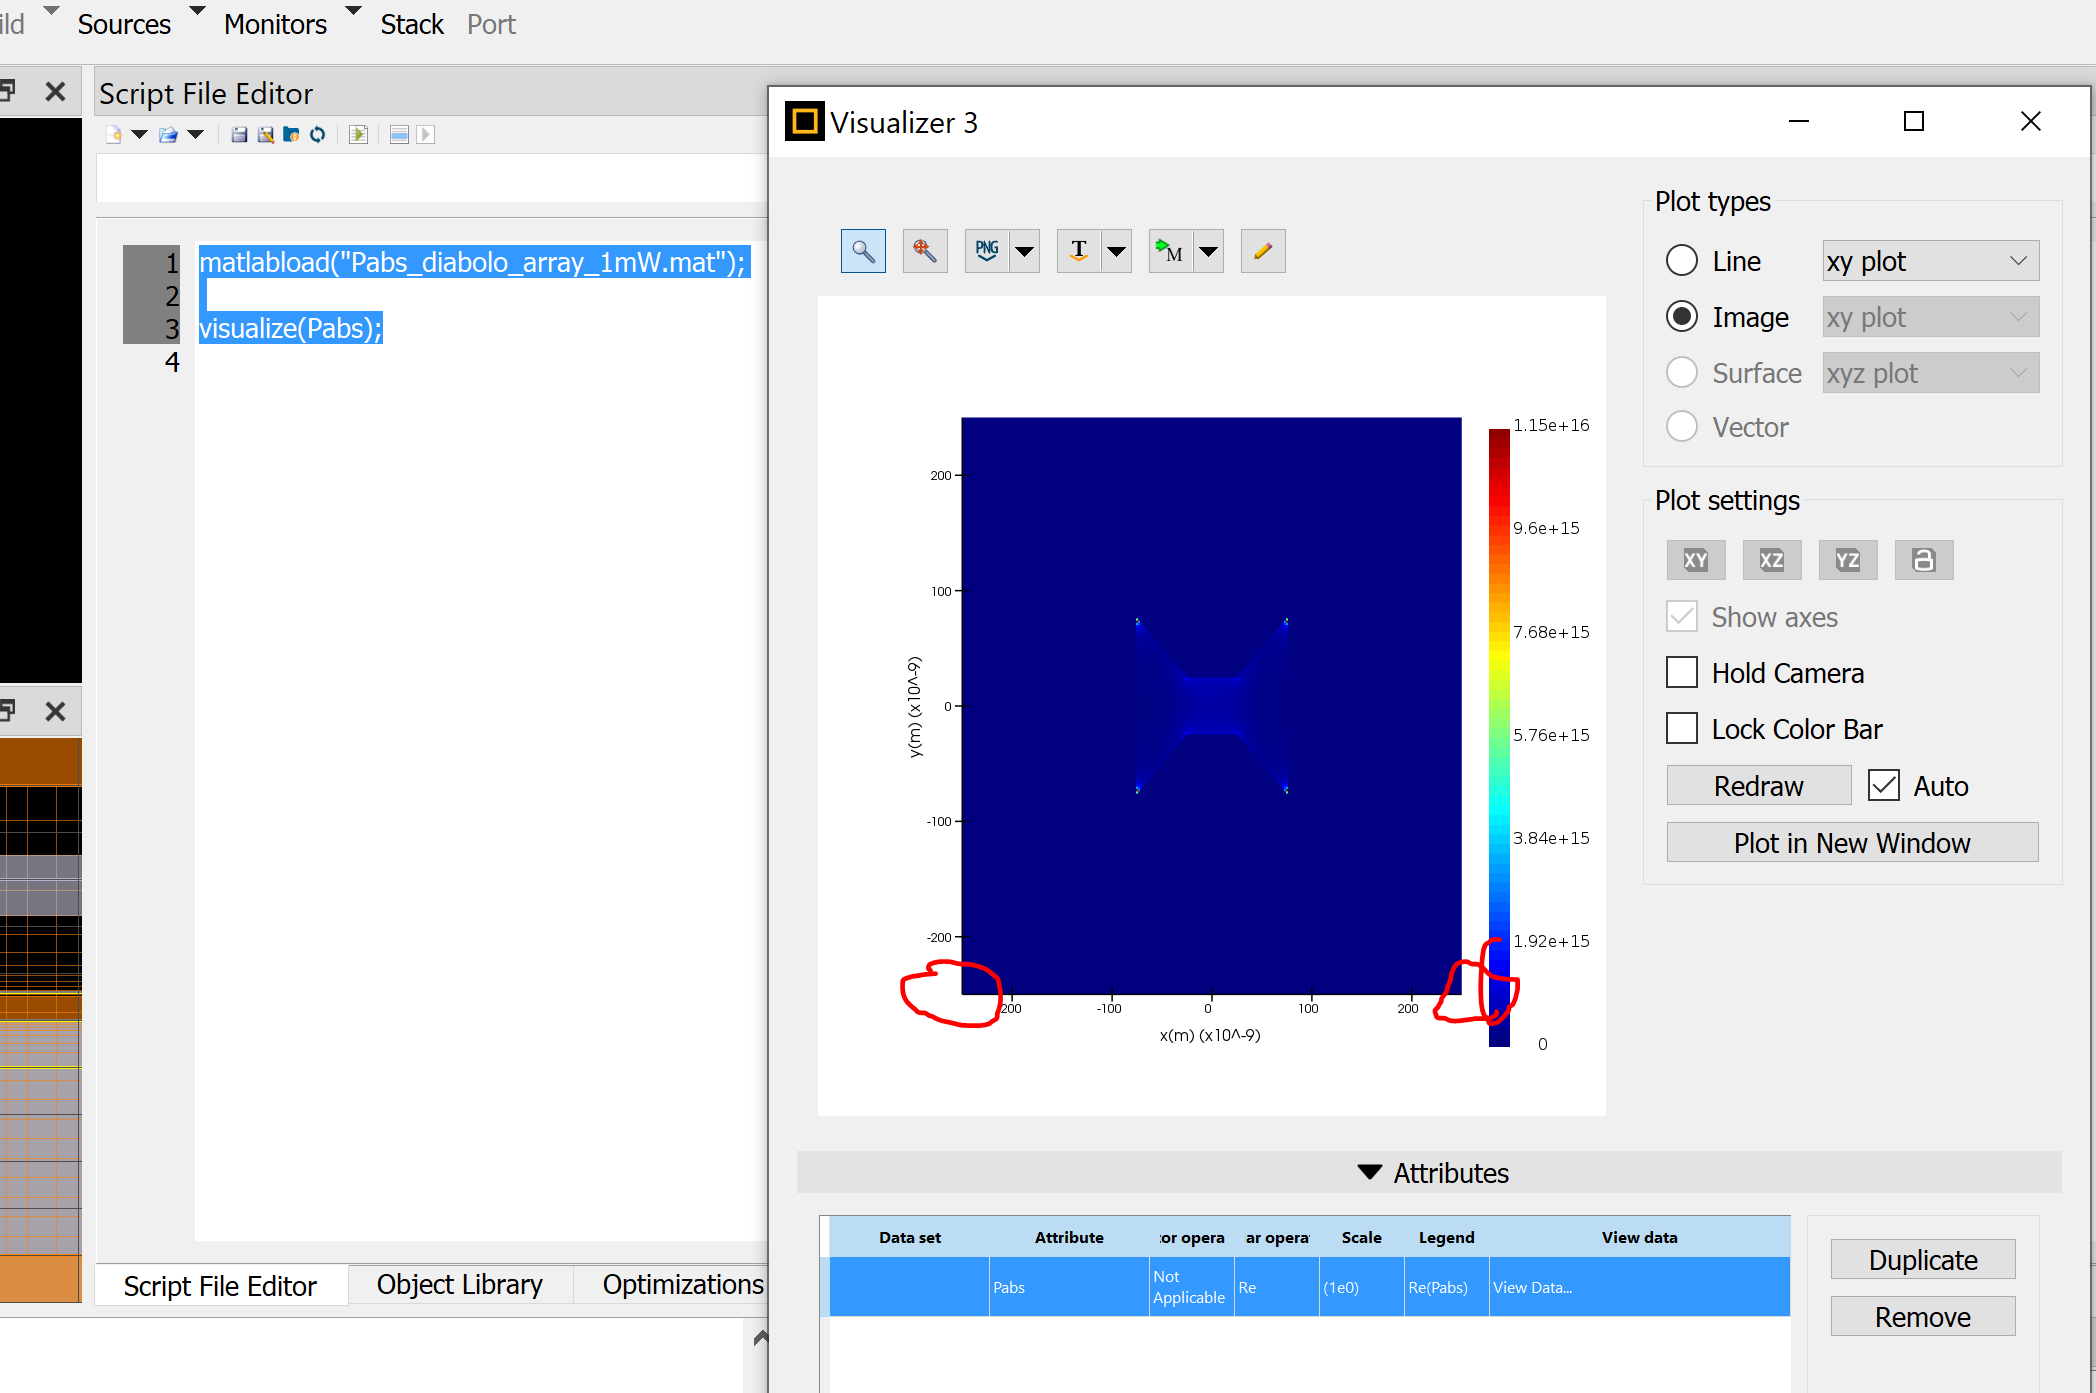
 3: load the matlab data, and visualize it:
 4: after modify HEAT simulation region, load the matlabdate, and visualize it:
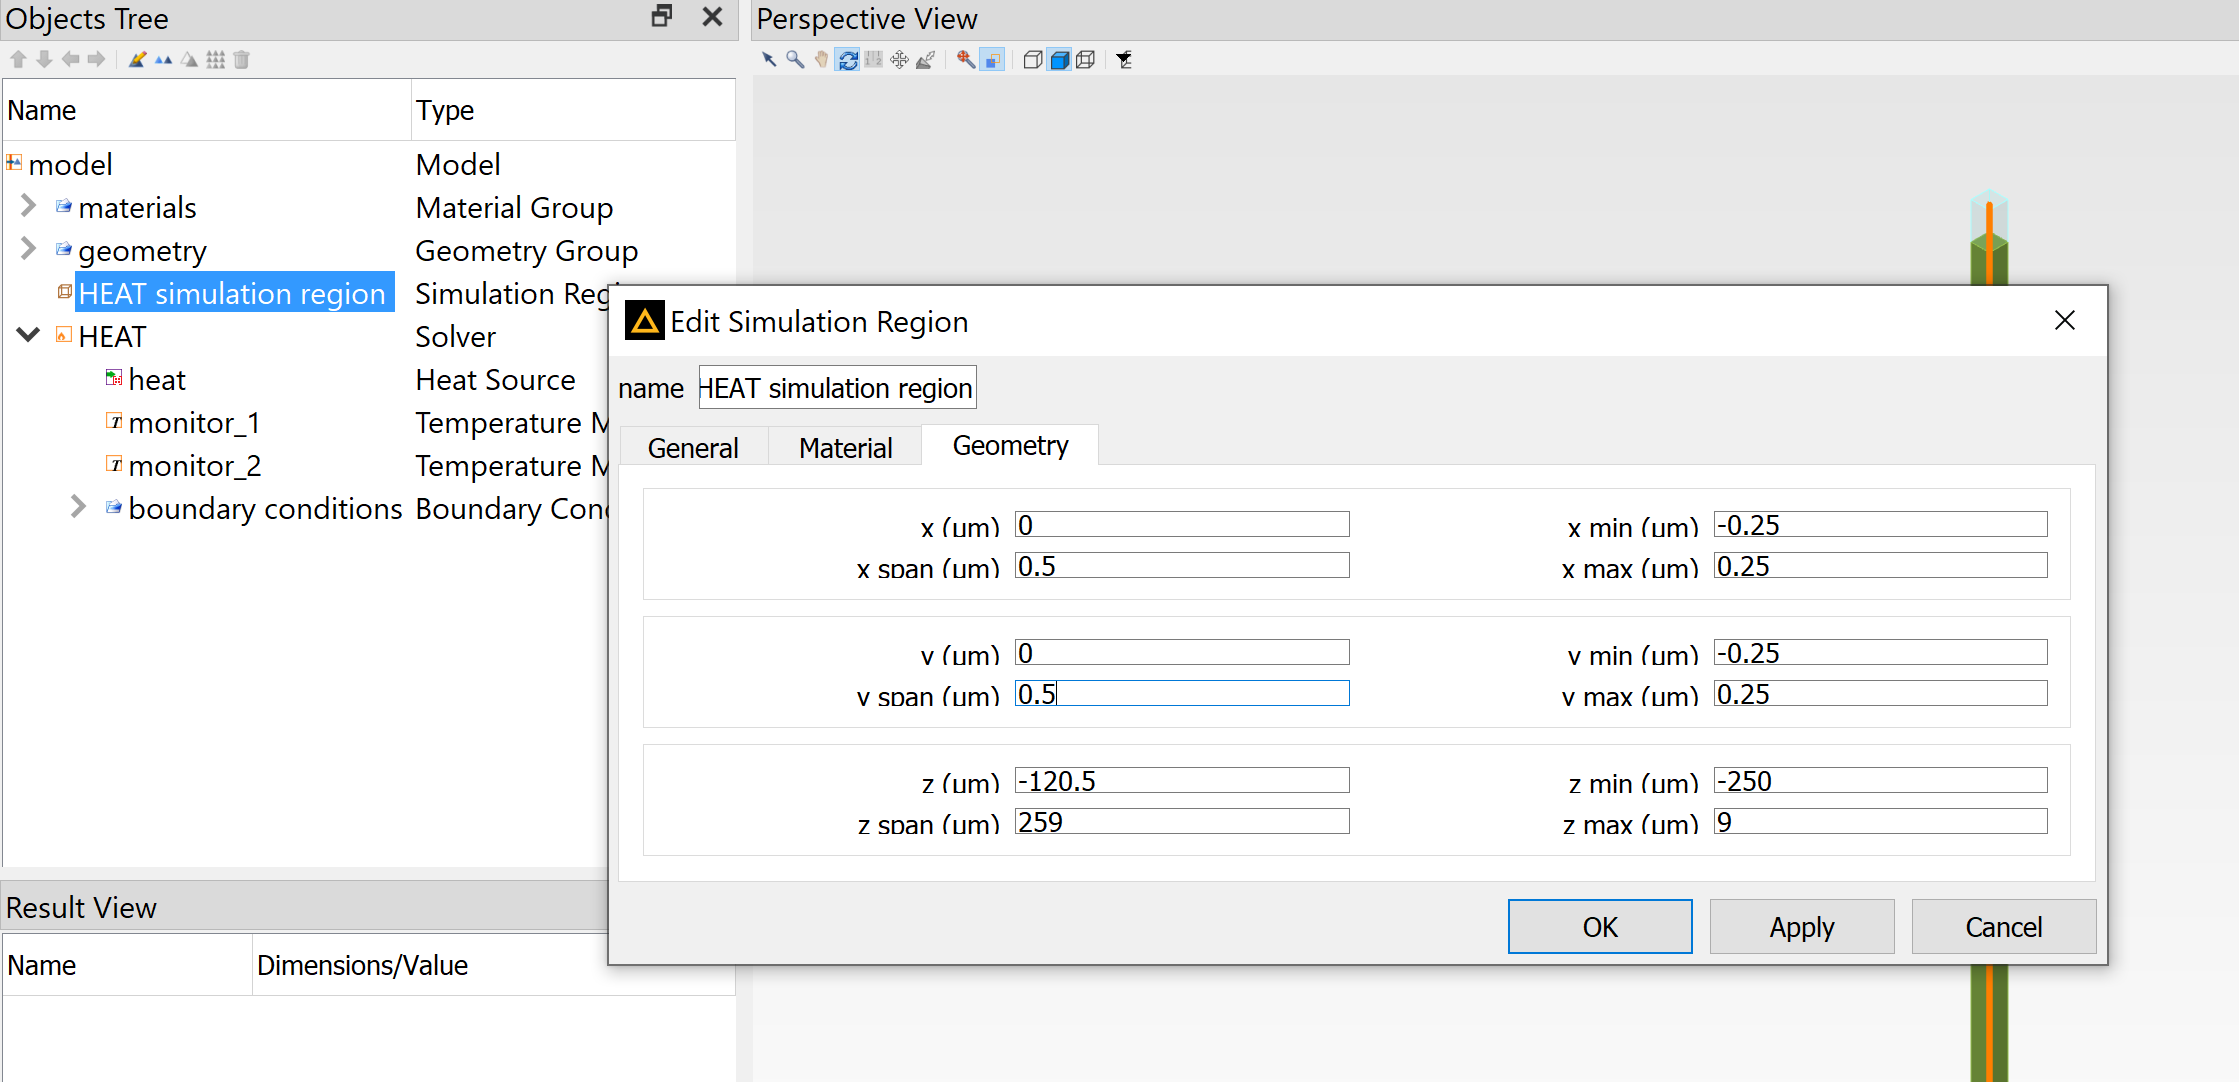
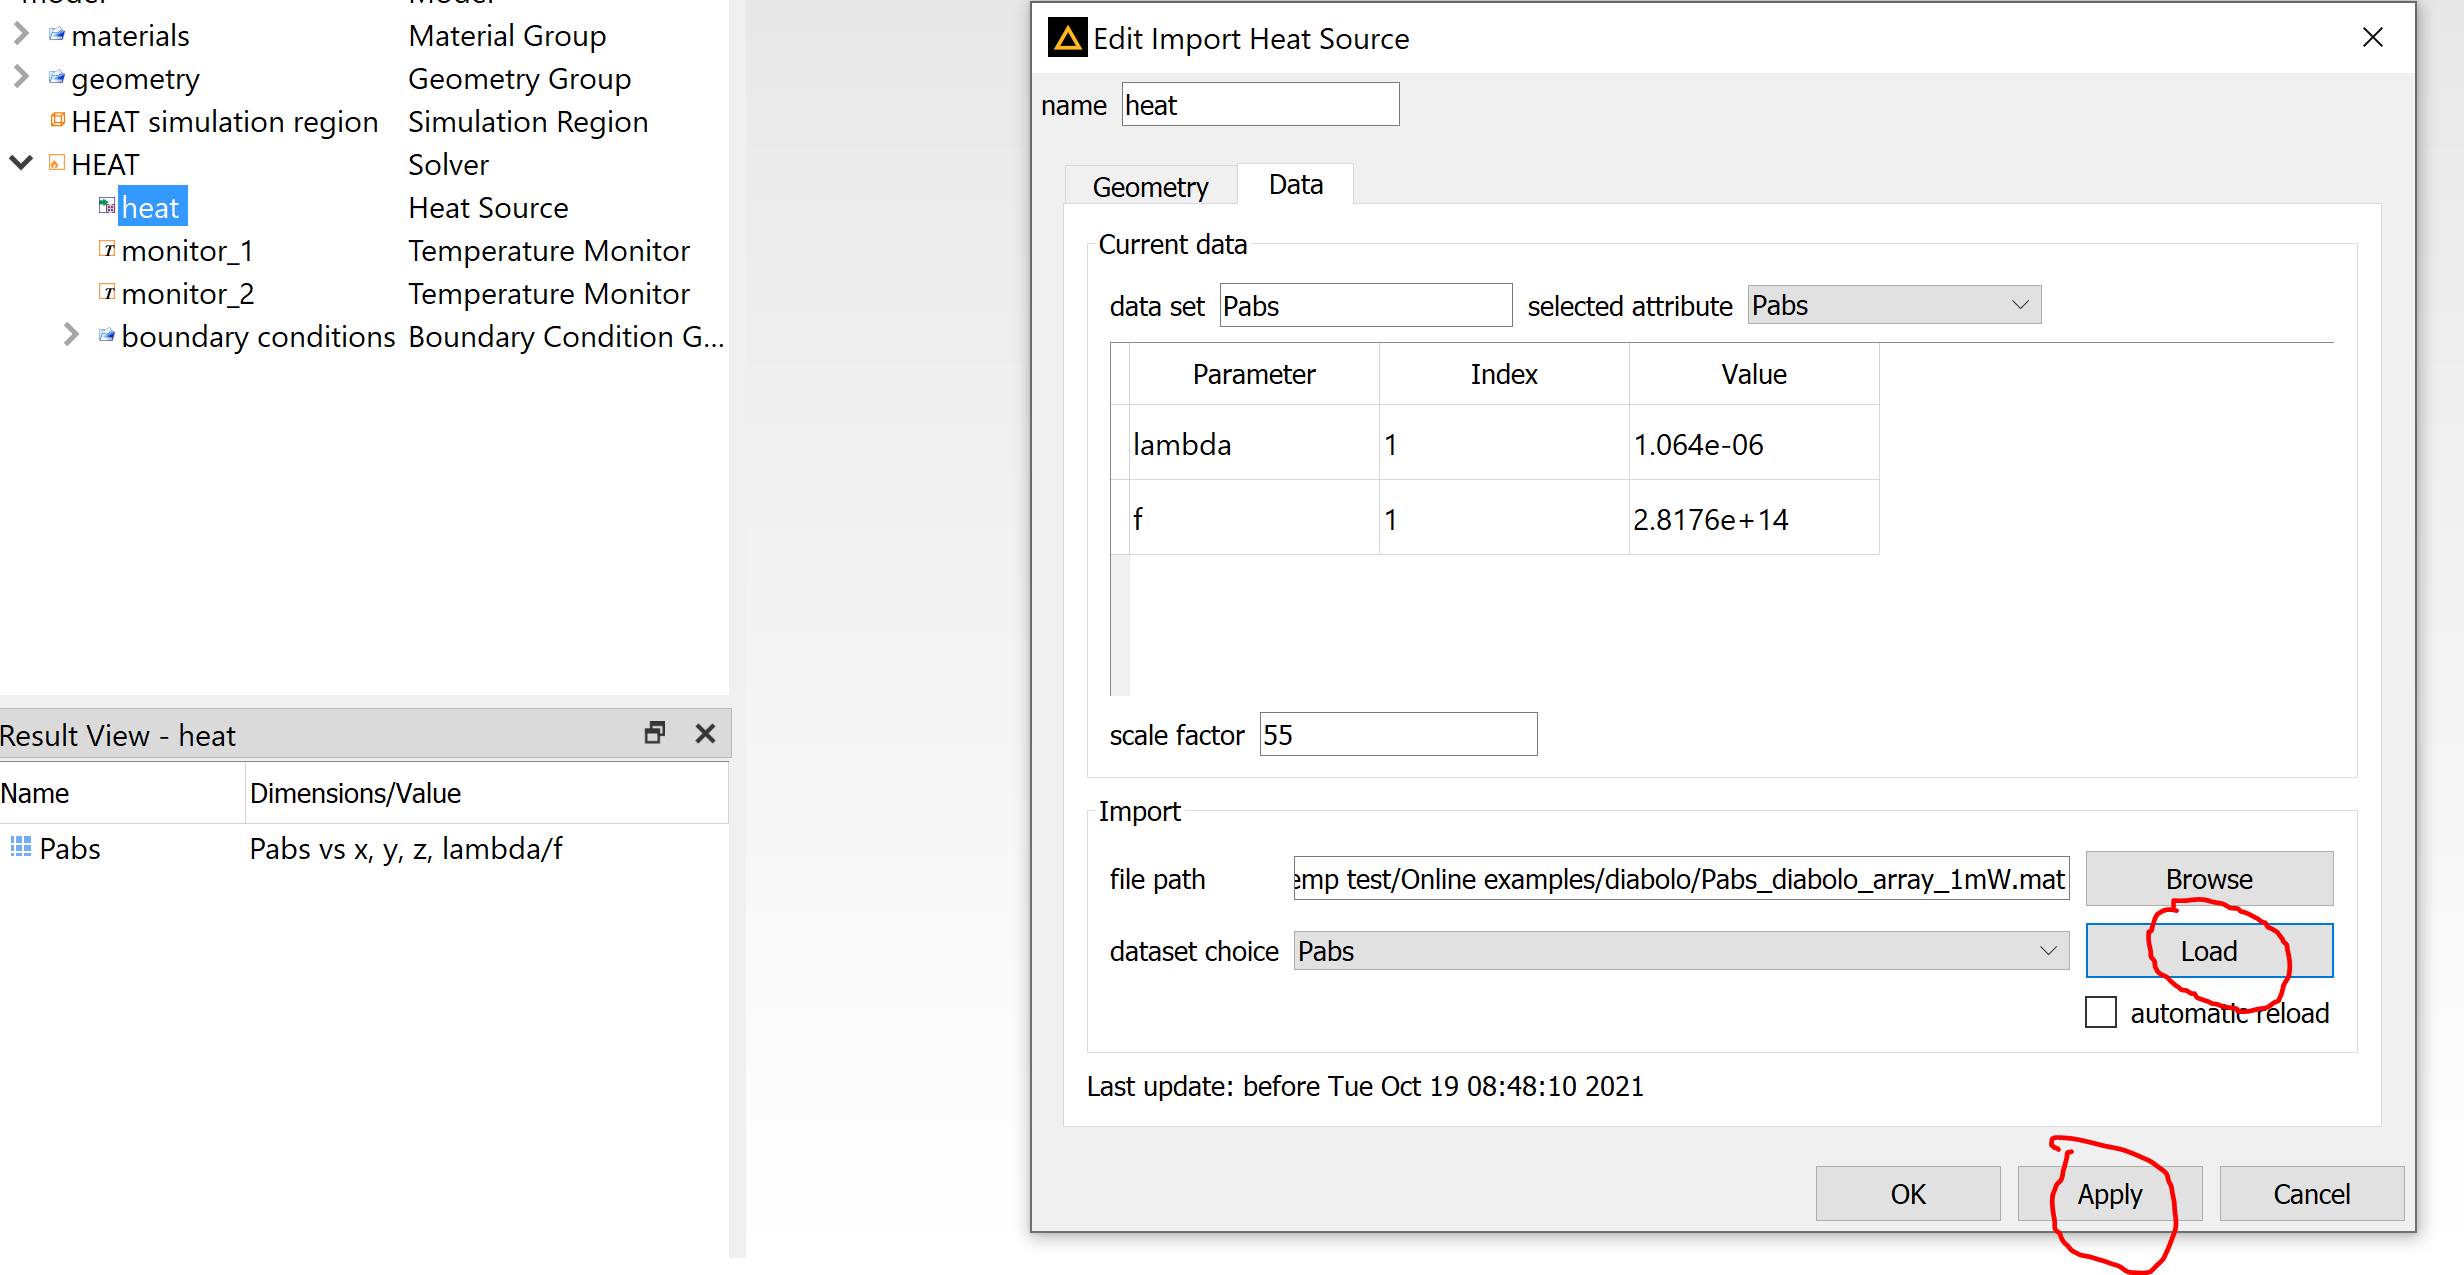
You may forgot to load it. I guess this is the root cause.
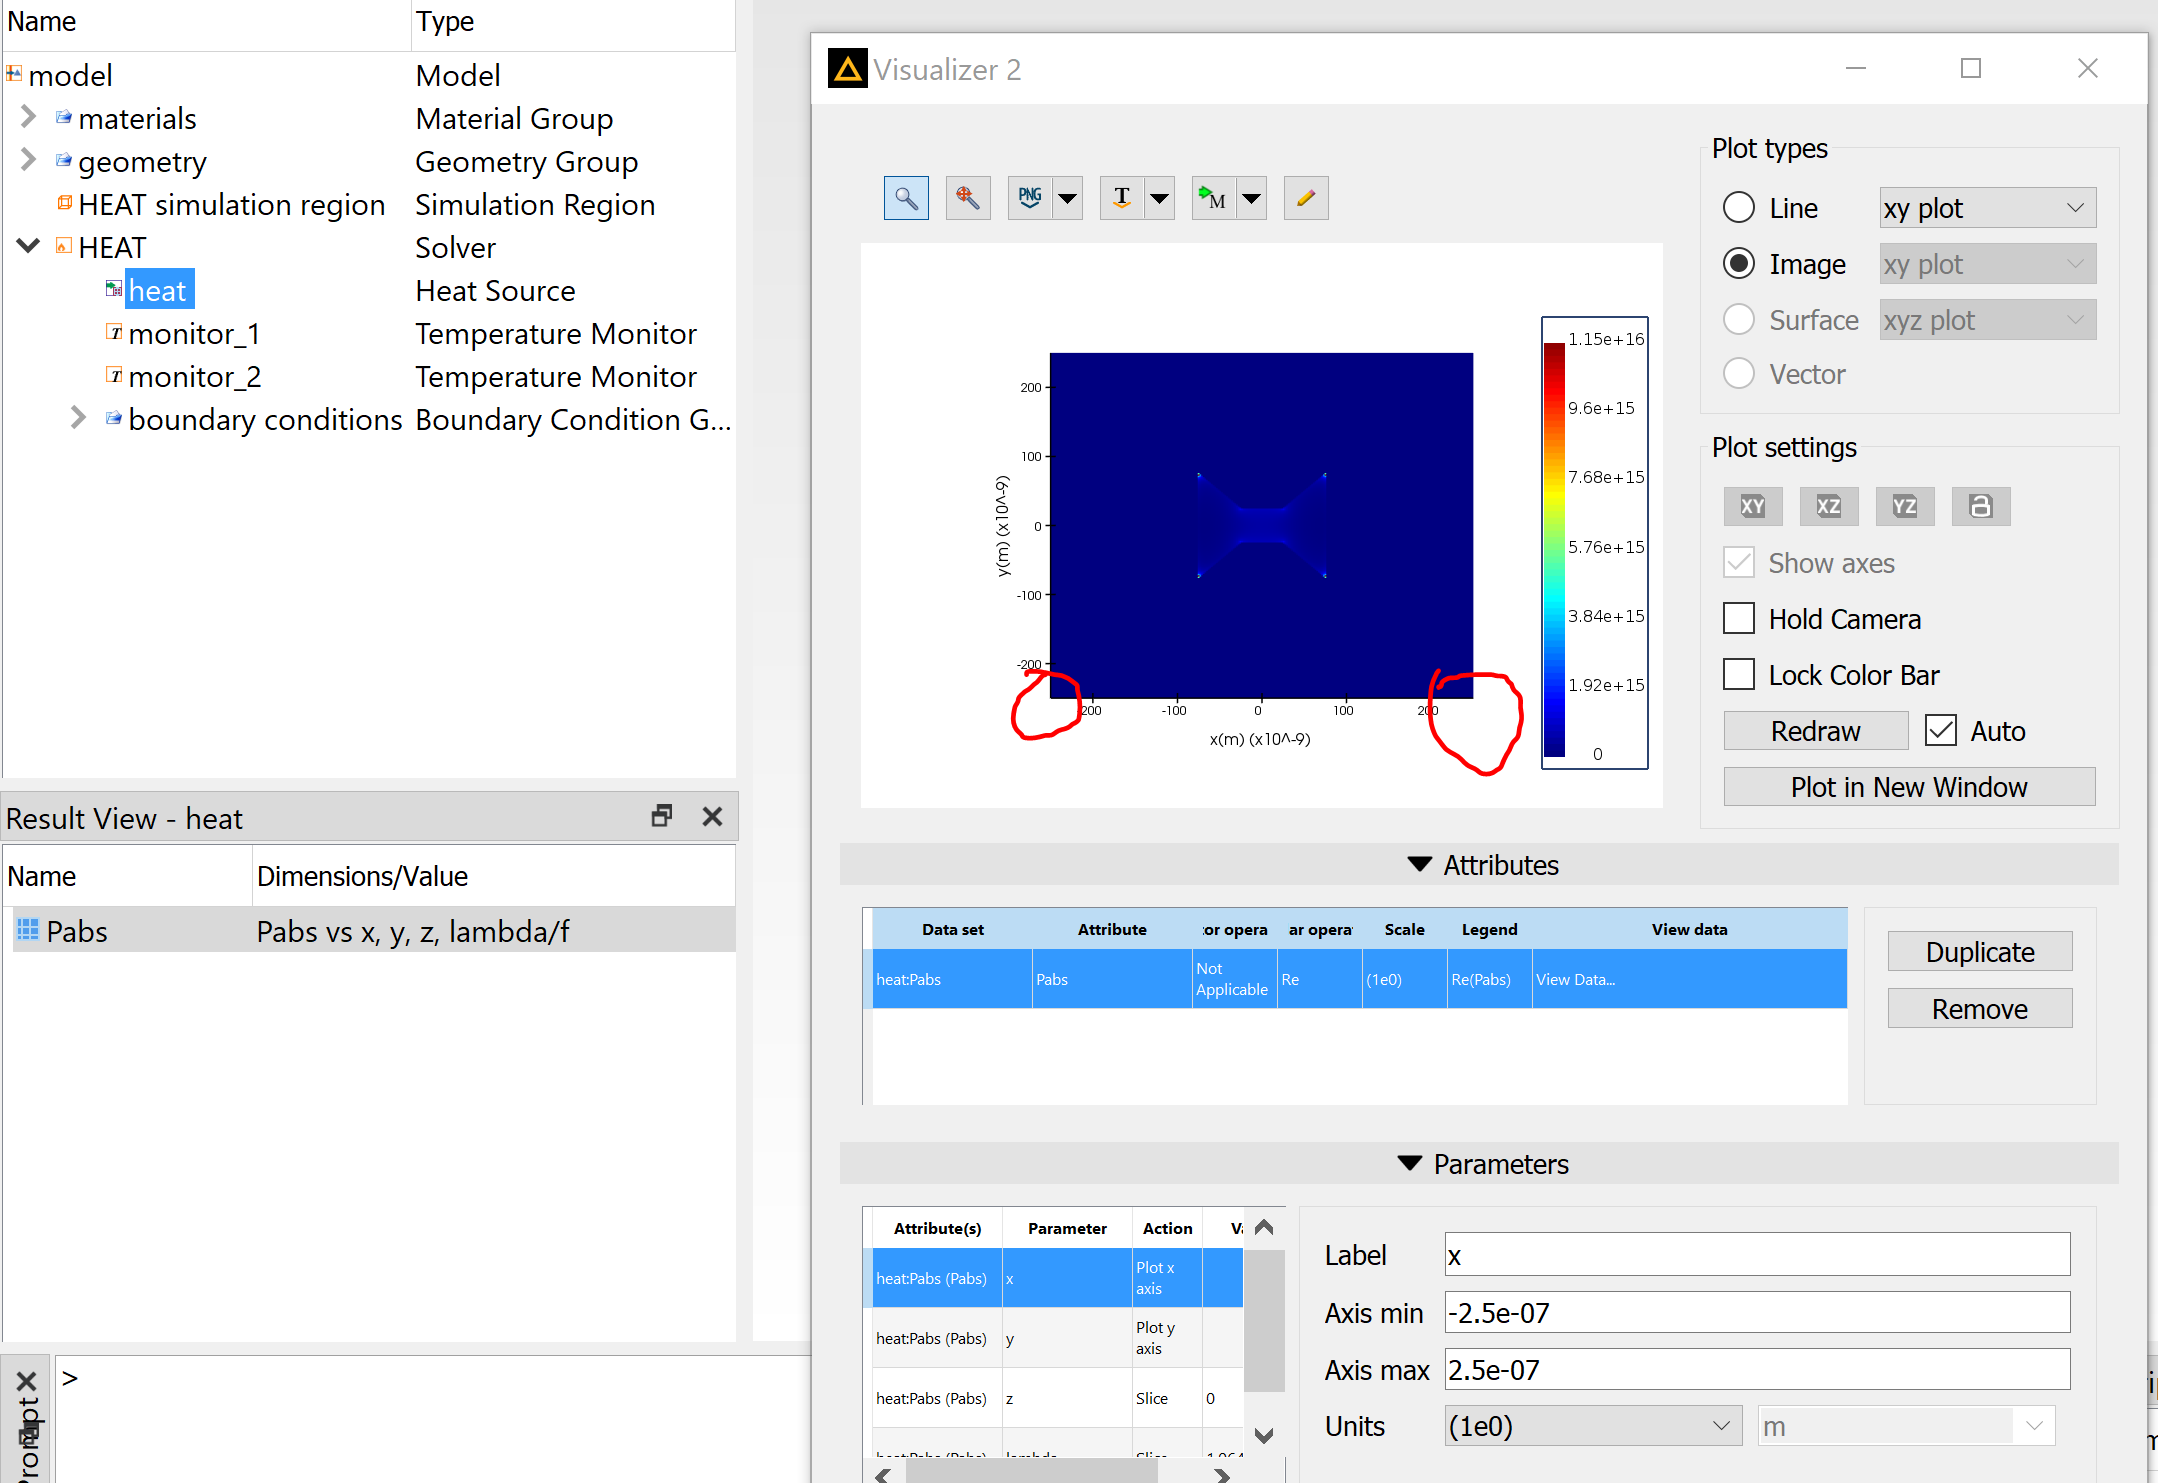
5: run HEAT and check the result
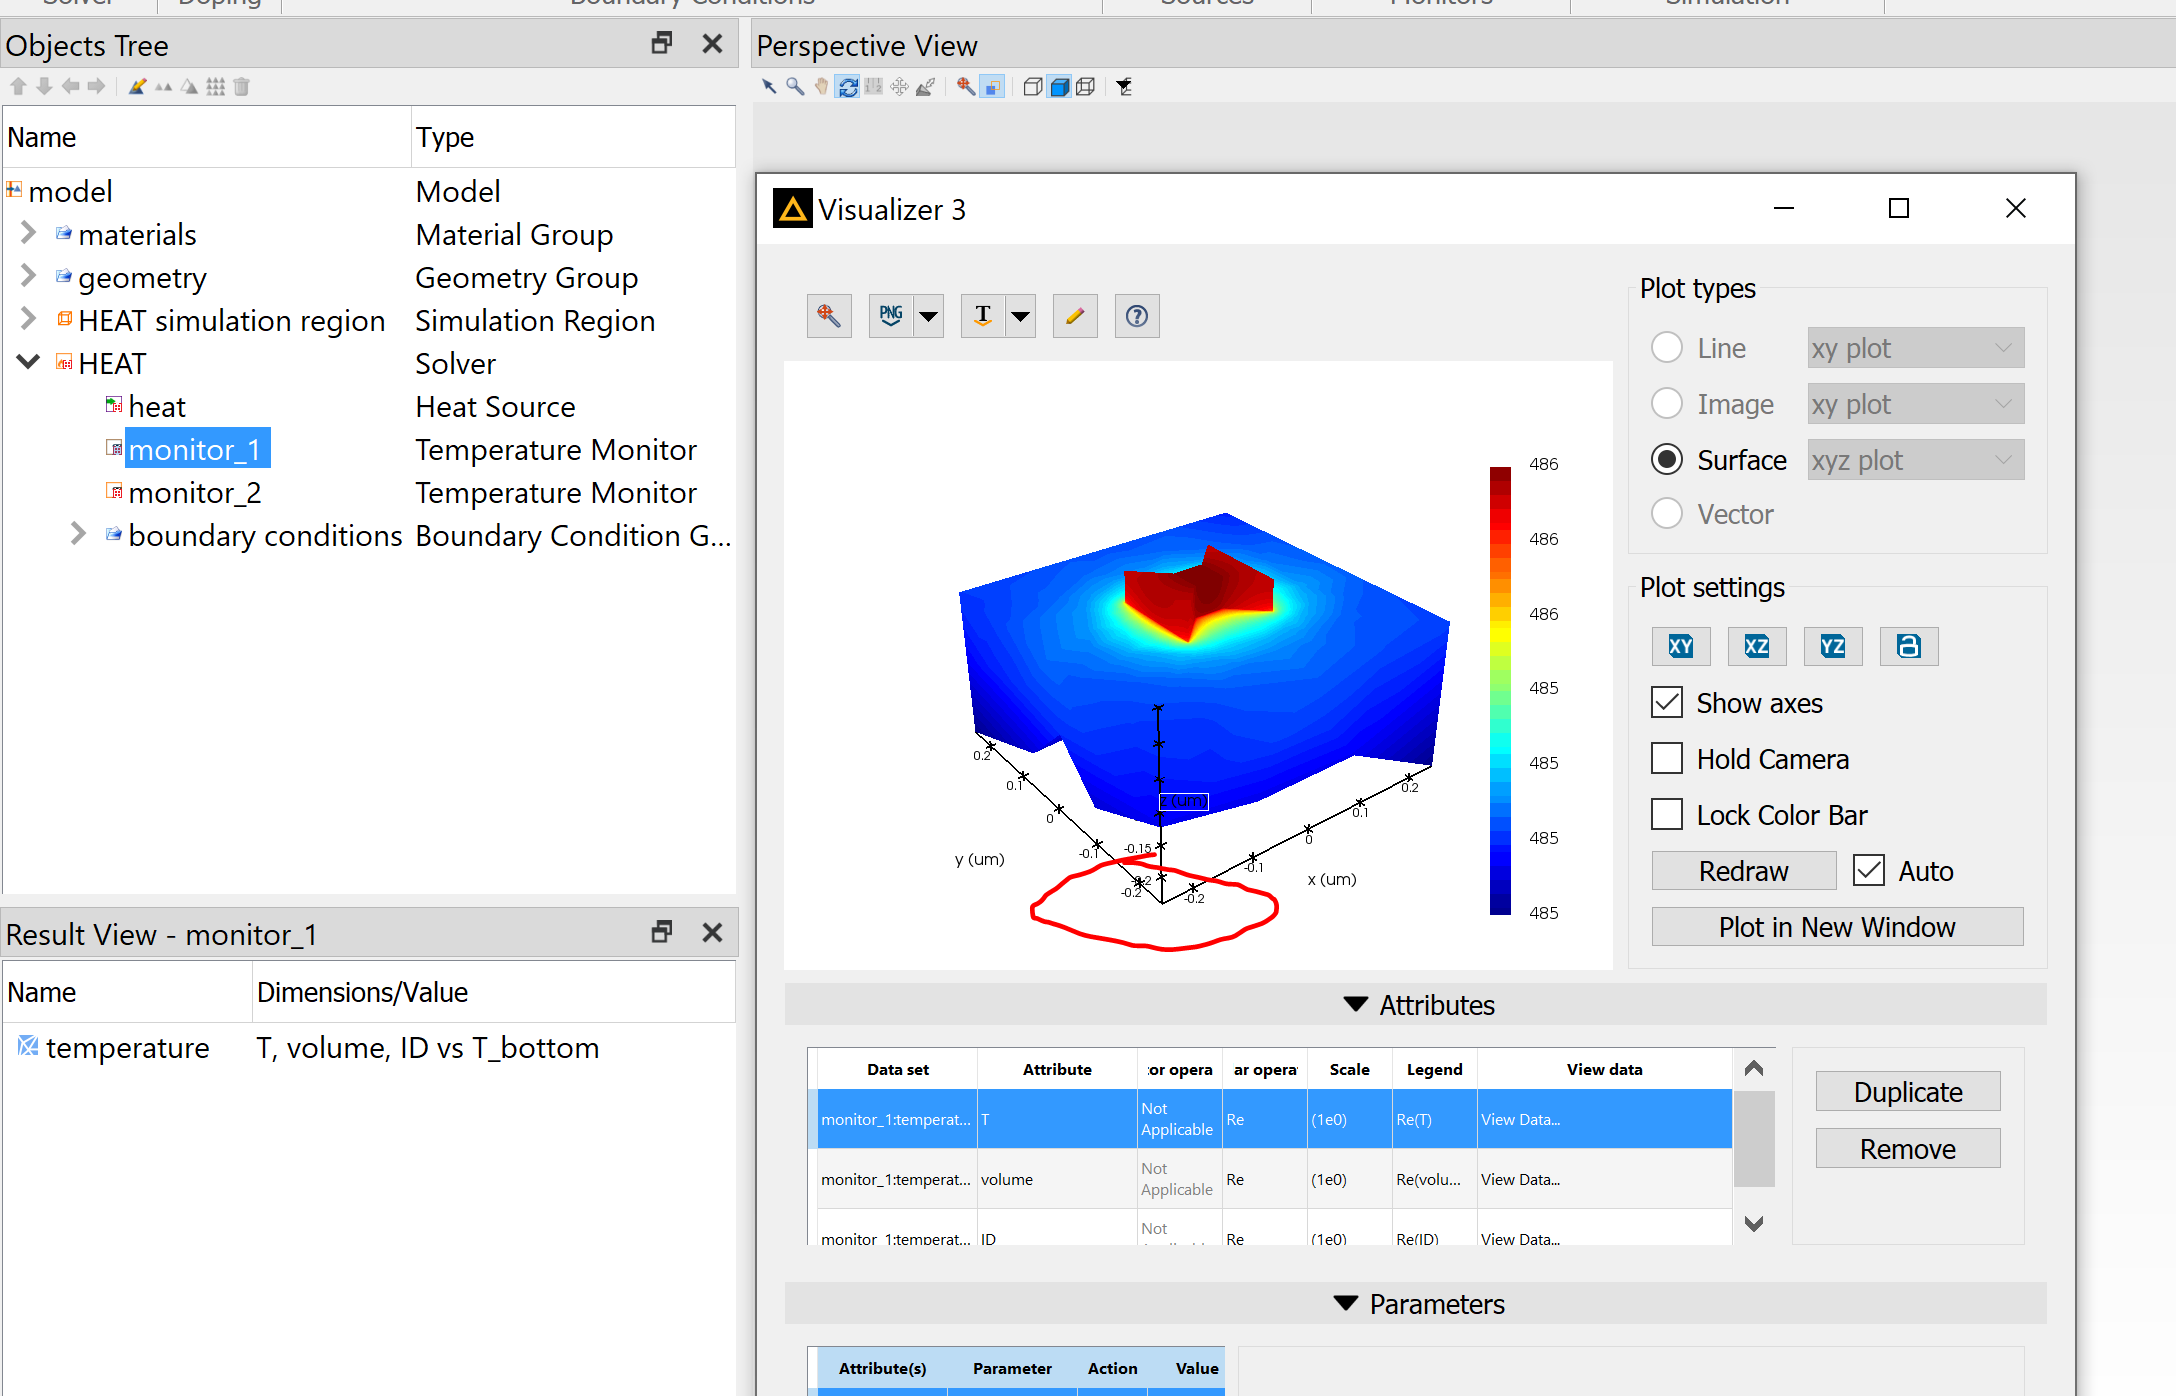
Monitor has size of 5*5um, so you do not need to change. But in general you need to check.
Please follow the above procedure and check which part went wrong.
October 24, 2021 at 6:57 pmniazulkhan
SubscriberOctober 25, 2021 at 3:55 pmGuilin Sun
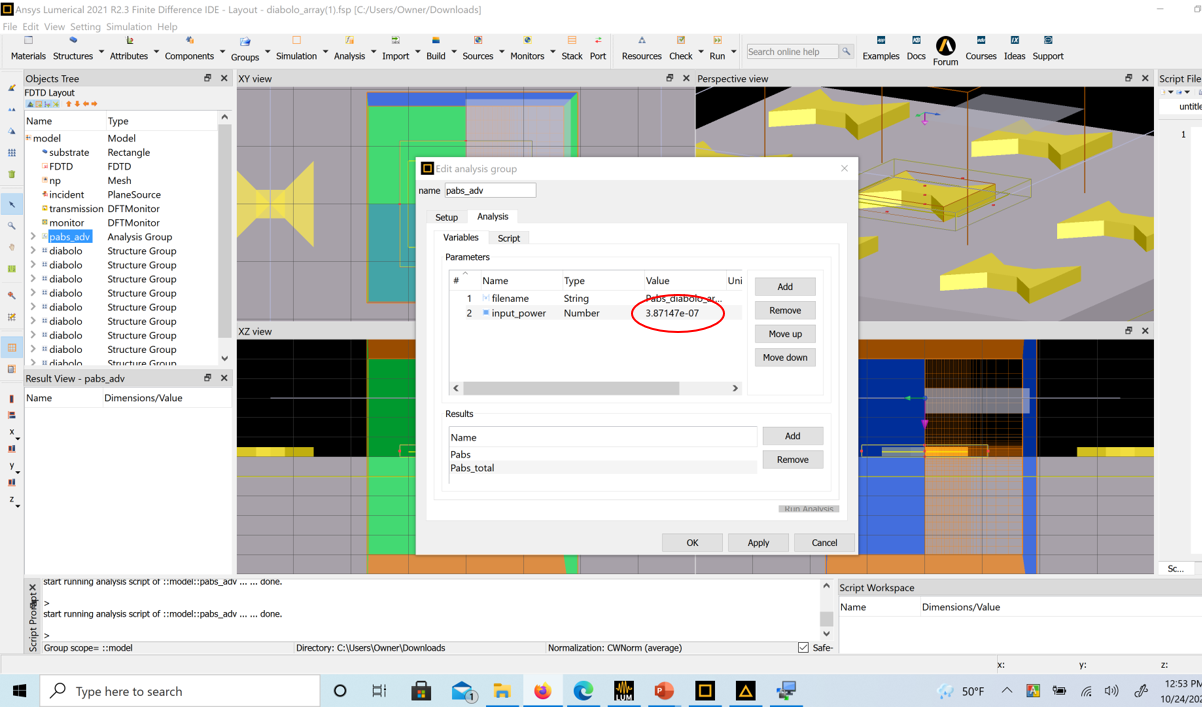
Ansys EmployeeSorry, Power is not "defined", it is an input parameter. If you want, you could do that way by calculating the power from the source amplitude and area. You can use "model" to pass parameters.
October 25, 2021 at 4:57 pmniazulkhan
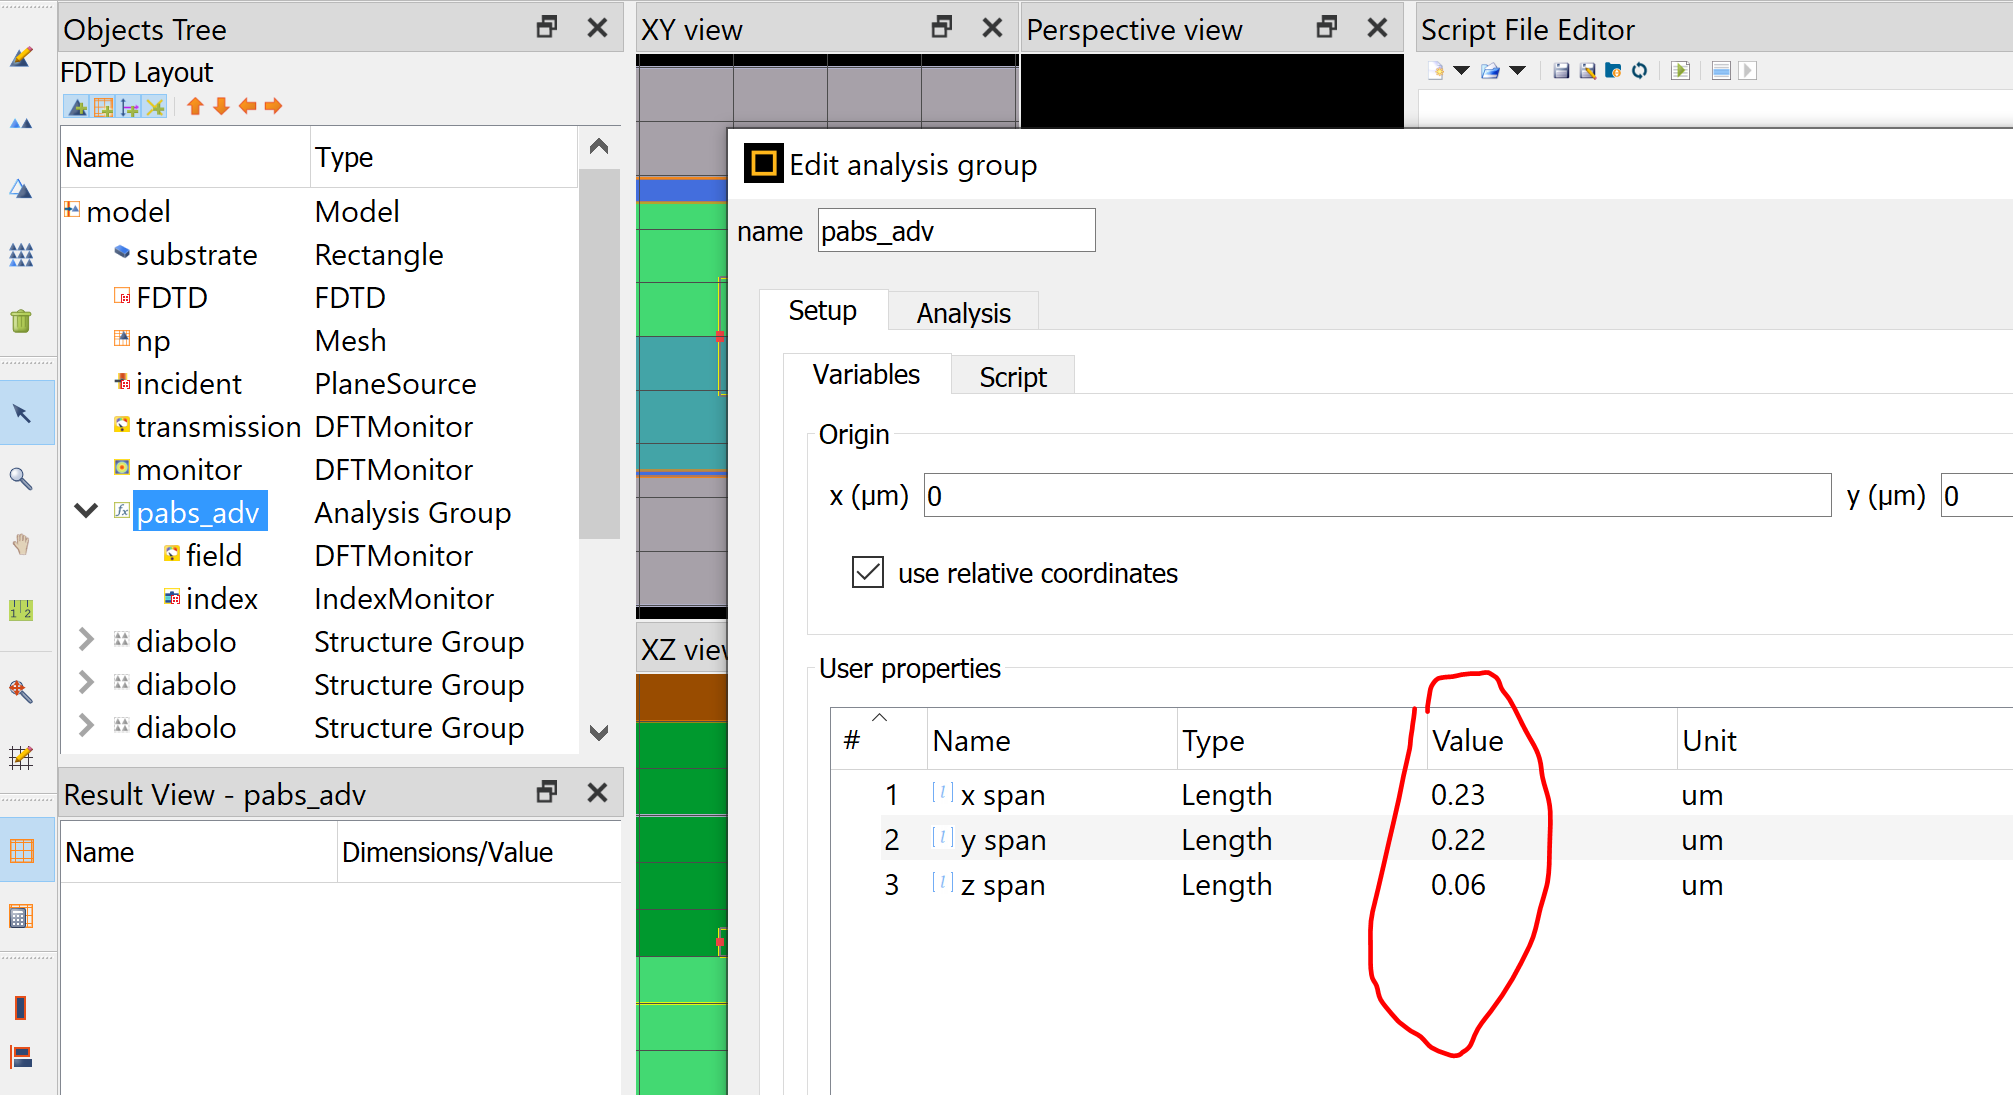
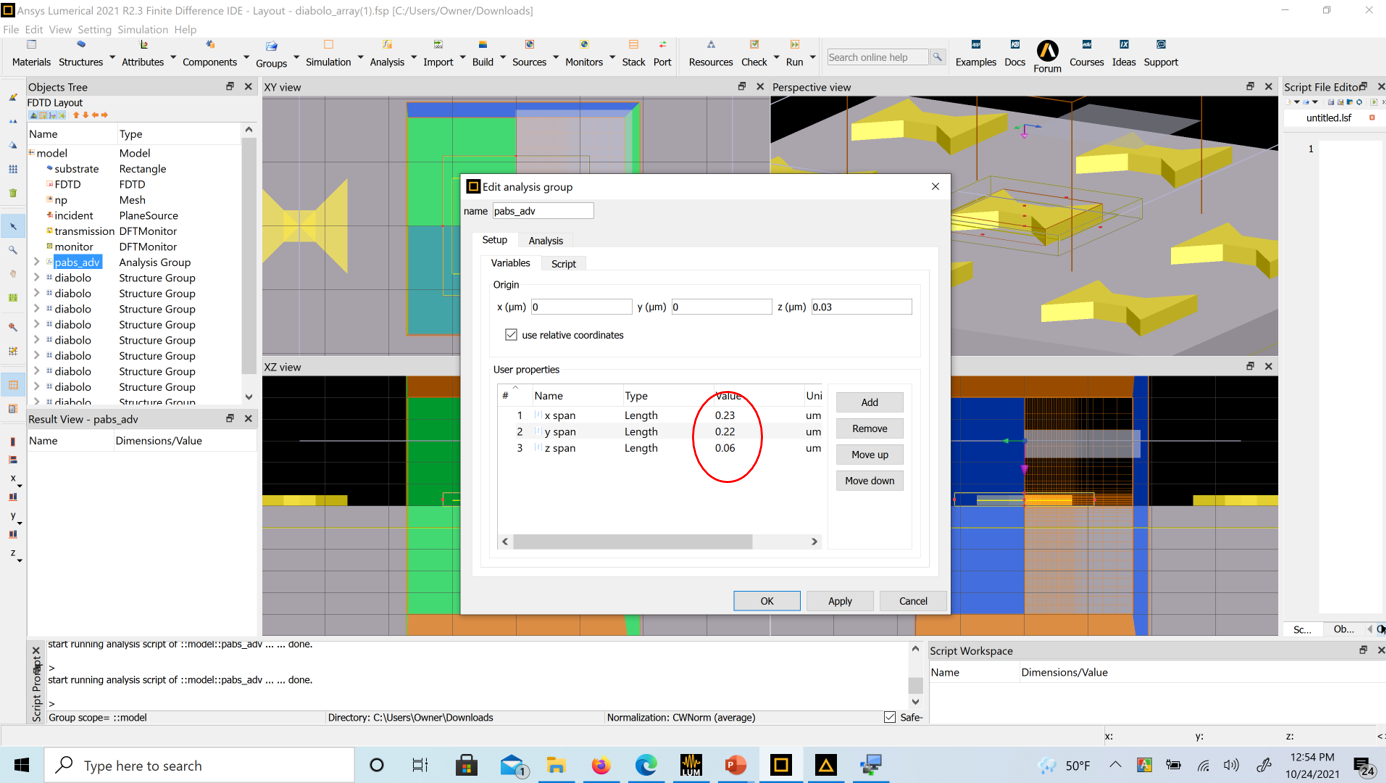
SubscriberThanks, but my question is on the choice of the dimension of the analysis group. Why is the dimension 0.23 um x 0.22 um x 0.06 um? I know the antenna size is 0.15um x 0.15um x 0.05 um.
October 25, 2021 at 5:47 pmGuilin Sun
Ansys EmployeeI think it is a little bit arbitrary. The monitor should be a little larger than the absorption region due to discretization and internal interpolation. If I do it, I would prefer to use 02*0.2*0.1 um, again it is arbitrary. It is the refractive index monitor data that is determines where the absorption is (the absorption is proportional to imag(permittivity)).
The online examples only give some description on critical parameters, which could be improved later for easy understanding.
October 25, 2021 at 8:10 pmniazulkhan
Subscriberthanks a lot.
October 25, 2021 at 9:42 pmniazulkhan
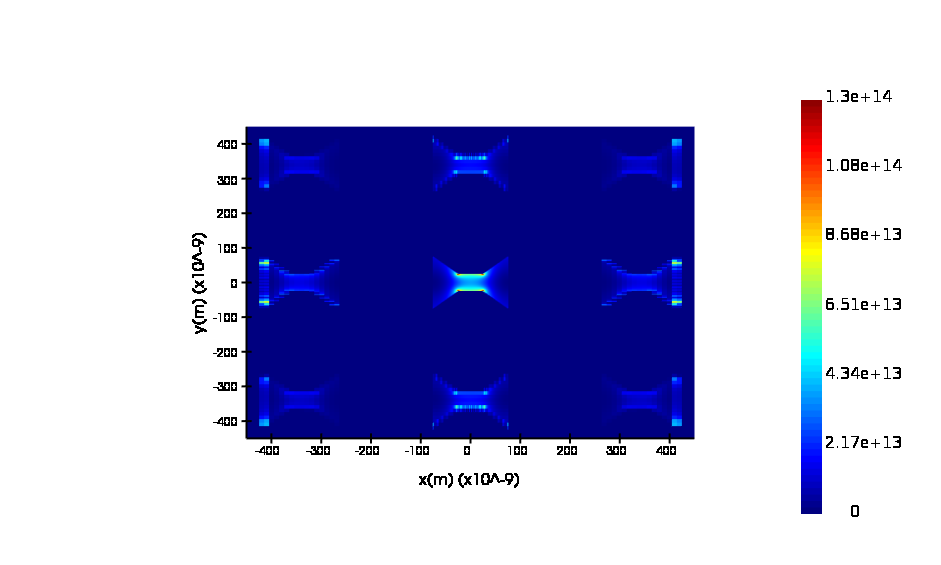
SubscriberAnother question I have in mind: if I extend the axis to (for example) 0.9 um x 0.9 um which will cover all the diabolo antennas of the array, I can visuazlie the absorption profile of all the antennas covered by this dimension in the Pabs visualizer as below:
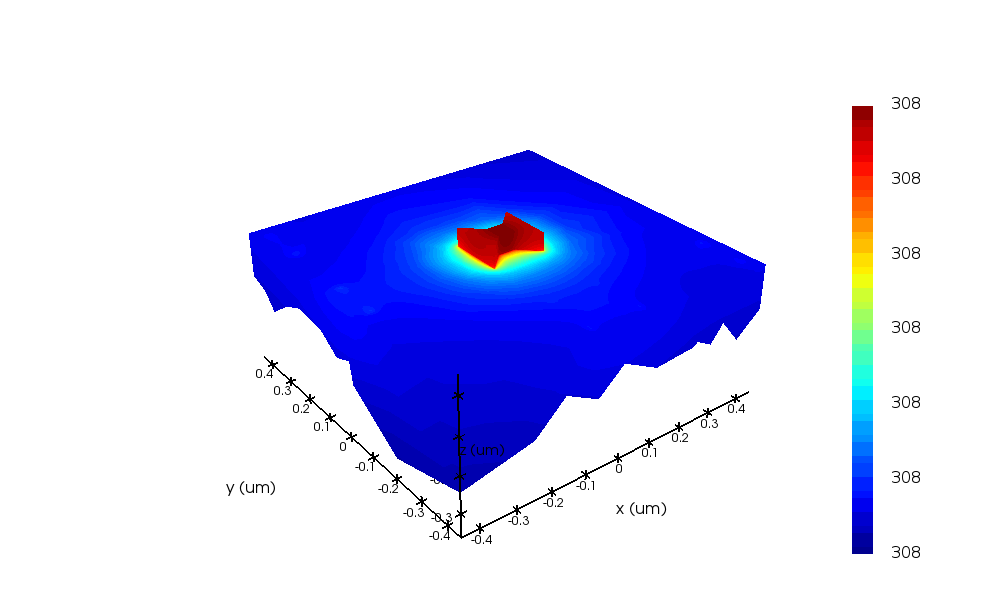
However, in the heat profile I can only see one antenna as seen below. If I am doing anything wrong?
October 25, 2021 at 10:16 pmGuilin Sun
Ansys EmployeeCould you please follow up the previous procedures I suggested and check where leads this issue?
Please narrow down the questions for this post. I believe that the original question has been resolved for periodic case.
For your new FDTD monitor profile, I am not sure the simulation condition so I cannot comment. If you still use the plane wave plus periodic BCs the results are incorrect as the antennas have different field profiles. Please write a new post with more details, if you still have questions. The ALF policy is for one question one answer.
November 1, 2021 at 2:07 amniazulkhan
SubscriberI understand the problem for different heat profiles, there was a problem in the meshing. Thanks. I am writing a separate post.
Viewing 17 reply threads- The topic ‘Changing X- and Y-axis range in the data visualizer’ is closed to new replies.
Innovation SpaceTrending discussionsTop Contributors-
5059
-
1770
-
1387
-
1248
-
1021
Top Rated Tags© 2026 Copyright ANSYS, Inc. All rights reserved.
Ansys does not support the usage of unauthorized Ansys software. Please visit www.ansys.com to obtain an official distribution.
-
The Ansys Learning Forum is a public forum. You are prohibited from providing (i) information that is confidential to You, your employer, or any third party, (ii) Personal Data or individually identifiable health information, (iii) any information that is U.S. Government Classified, Controlled Unclassified Information, International Traffic in Arms Regulators (ITAR) or Export Administration Regulators (EAR) controlled or otherwise have been determined by the United States Government or by a foreign government to require protection against unauthorized disclosure for reasons of national security, or (iv) topics or information restricted by the People's Republic of China data protection and privacy laws.

