-
-
December 12, 2024 at 7:25 pm
Osama Maddani
SubscriberI want to copare the Cp distribtution of two fluent cases in CFD post, how to plot a Pressure Coeficient difference contour.
basically I want the contour of the difference.
There is an option of "case comparison" in the CFD post software, though i didnt understand how to apply that properly.
basically the two cases have different mesh files, case files and solution files.
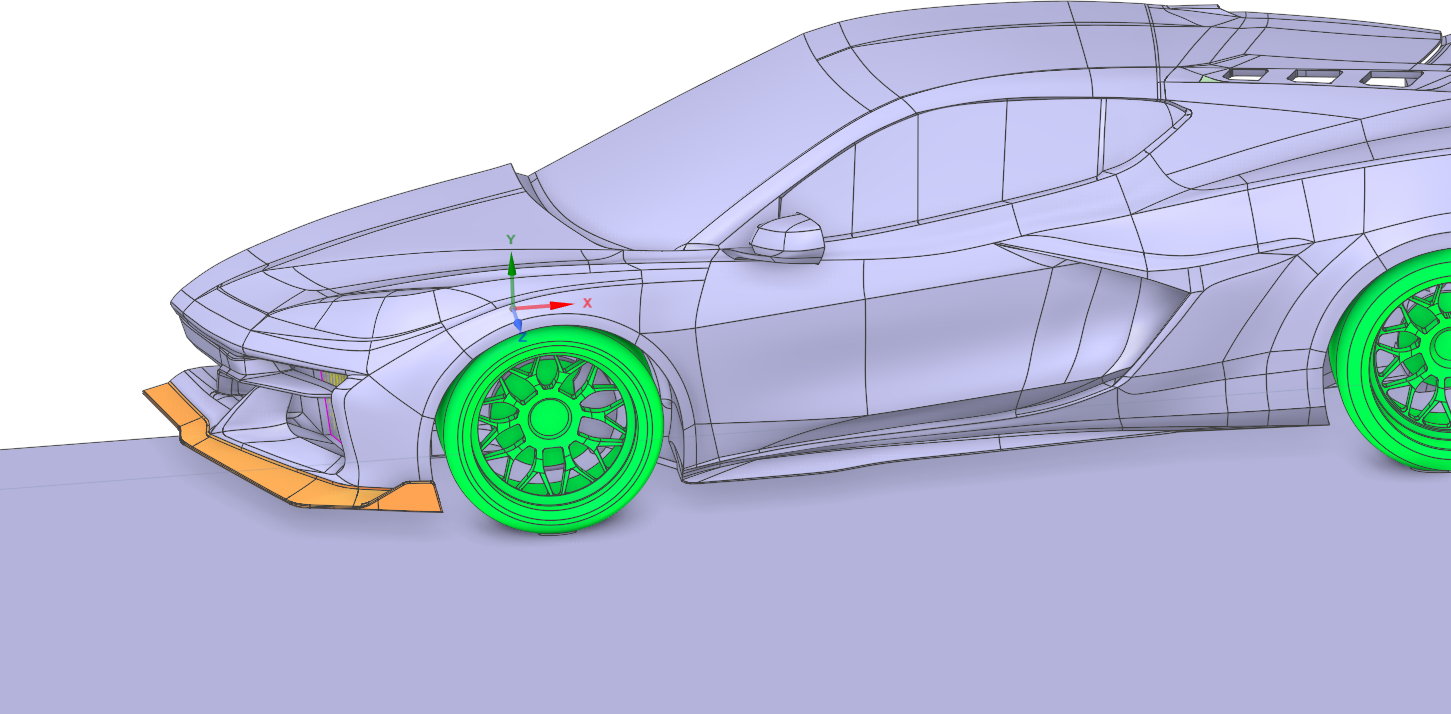
Though in geometry they are the same apart from the front splitter.when looking at the lift force report per zone in fluent i find that adding that splitter to the otherwise identical geometry model, the "car body" wall has gained an amount of 79N of lift in itslef, the splitter has got a difference of - 58N (negative lift).
the other walls like rear spoiler, wheels etc, have got very similar amounts of lift force, only the body has had a different lift due to the flow interaction i assume.
this is why i want to make a contour of the difference between the two. a plot of the differences only so i can see where the Cp is different and understand what is happening -
December 18, 2024 at 1:20 pm
RS
Ansys EmployeeSteps to follow for Case comparison:
- Open a .dat file in CFD- load additional results and enable, the Keep current cases loaded toggle. Each file is shown separately in the Outline tree and the Viewer (Refer below screen shot)
- After loading multiple files, select Case Comparison from the Outline tree (Refer below screen shot)
- Click Apply. Automatically generates difference variables and plots (Refer below screen shot)
-
- You must be logged in to reply to this topic.


-
4613
-
1530
-
1386
-
1209
-
1021

© 2025 Copyright ANSYS, Inc. All rights reserved.


