
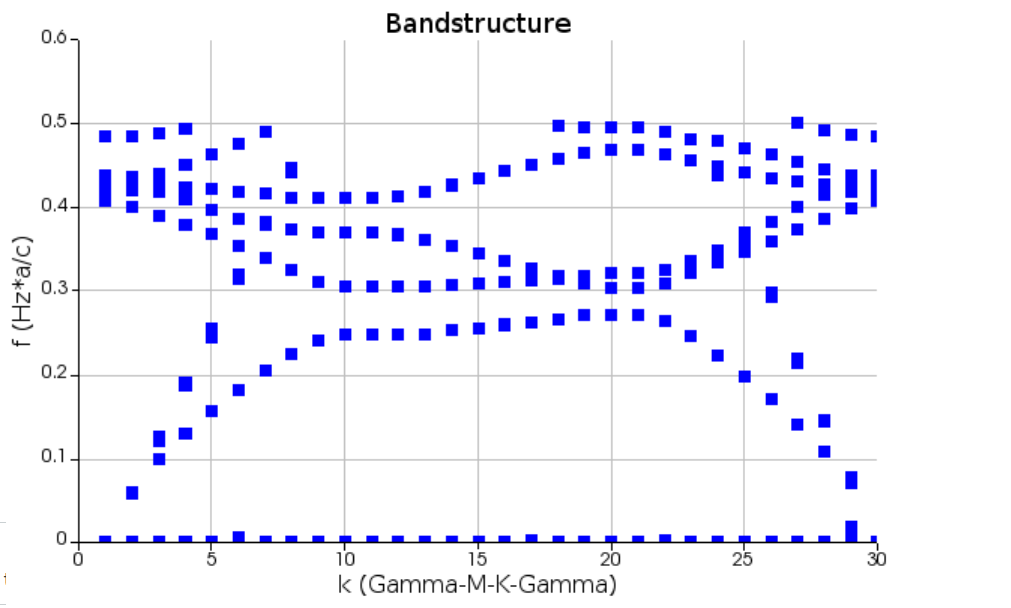
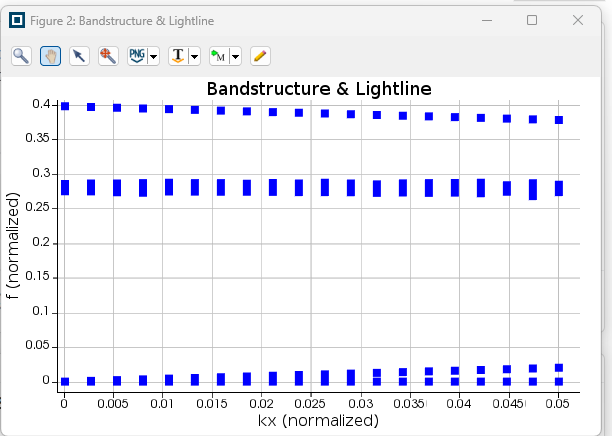
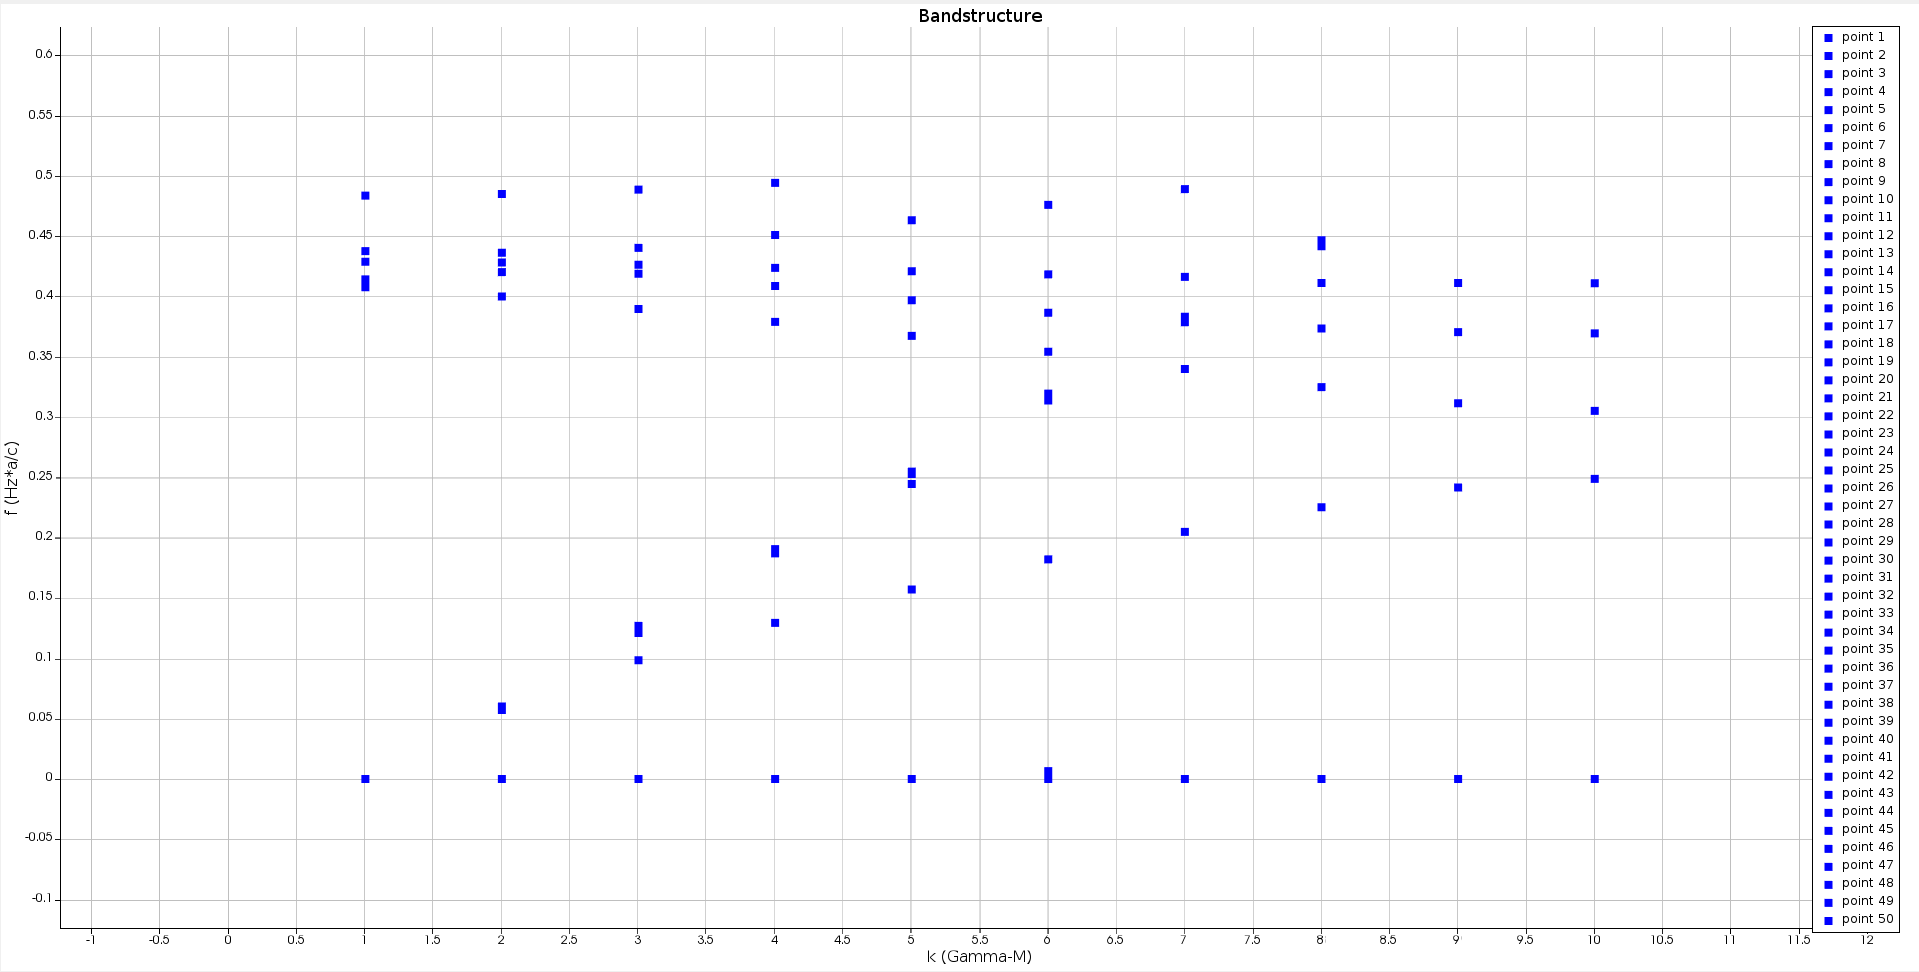
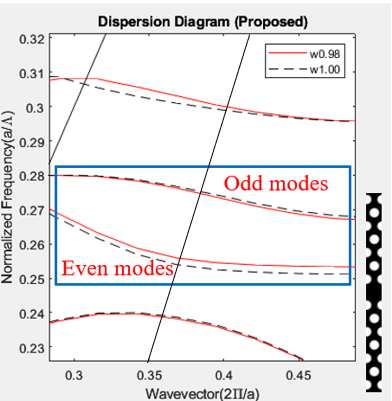
Bandstructure of planar photonic crystal with a hexagonal lattice


Viewing 8 reply threads
- The topic ‘Bandstructure of planar photonic crystal with a hexagonal lattice’ is closed to new replies.


