TAGGED: -Photonic-crystal, bandstructure, fdtd
-
-
March 28, 2024 at 10:40 am
Martin Veis
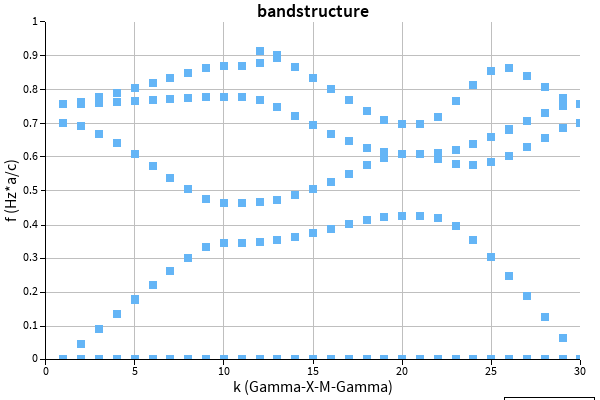
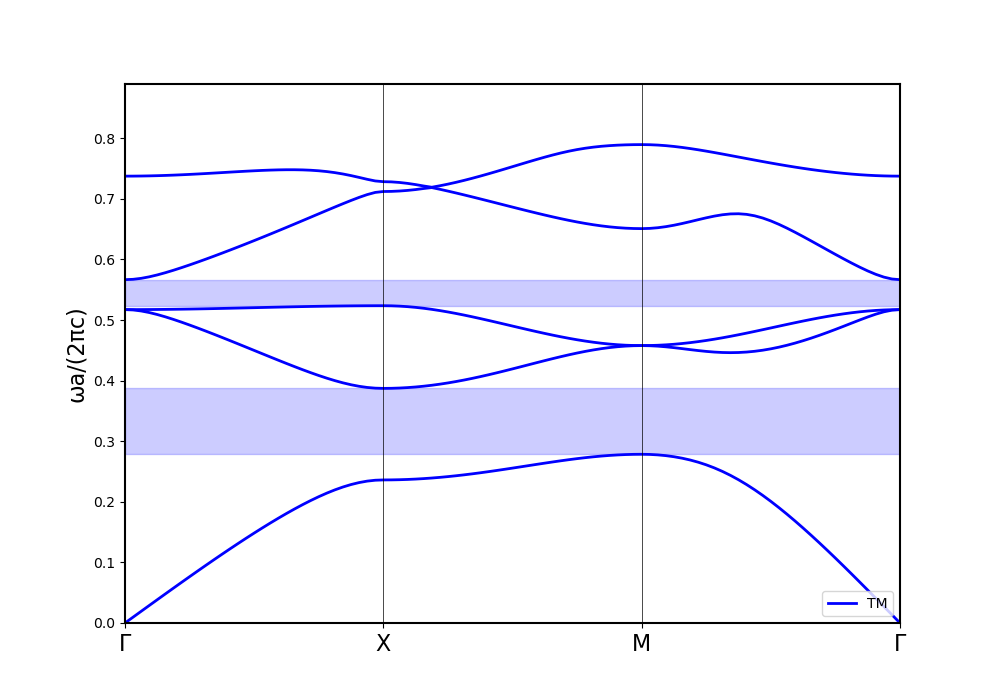
SubscriberI have noticed a strong disagreement in bandstructure calculation in comparison to MIT photonic bands.To demonstrate this, here is the bandstructure obtained from the band structure example: https://optics.ansys.com/hc/en-us/articles/360041566614-Rectangular-Photonic-Crystal-BandstructureSquare lattice 2D TM mode:Calculating a bandstructure of exactly the same structure using MPB (https://mpb.readthedocs.io/en/latest/) I obtain:
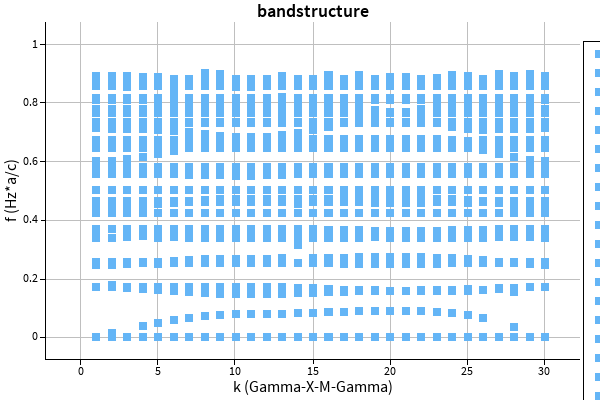
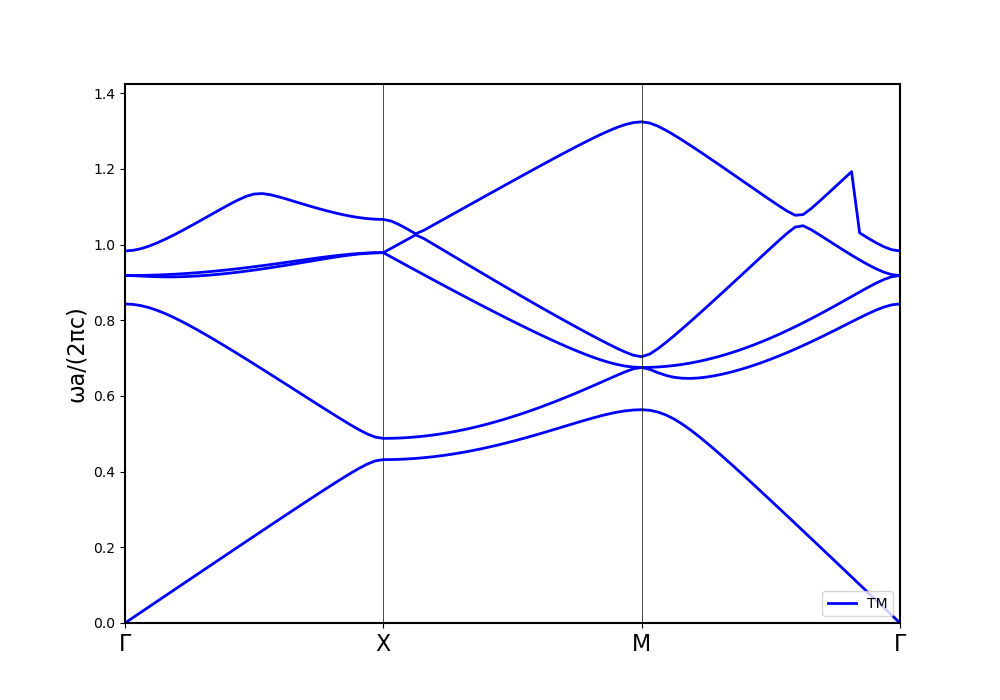 Those band structures are more or less in agreement, the shape is identical, and the energy axis seems to be a little scaled (apparent at 0.4 energy scale)Now, increasing the refractive index in both solvers to 10 leads to the following results:The shape of the bands is similar again, but this time, the energy axis is drastically scaled. Other calculation methods hint towards MPB being correct.How do I combat this issue of energetical disagreement for high permittivity simulations?Thank you,Martin
 -
March 28, 2024 at 9:06 pm
Guilin Sun
Ansys EmployeeYou may need to check the simulation time you used in the high-index simulation. If the simulation time is too short, it cannot capture the resonance; if it is too long, only high-Q resonance is captured so there are missing points on the bands.
You may need to limit the frequency max since much higher bands usually are not interested.
-
April 3, 2024 at 8:56 am
Martin Veis
SubscriberI have tried increasing the simulation time up to 10 times the original 10 000 fs, but the result remains unchanged. I am limiting the frequency to visualize only the first five bands, but in Lumerical, many more bends appear in that frequency range.
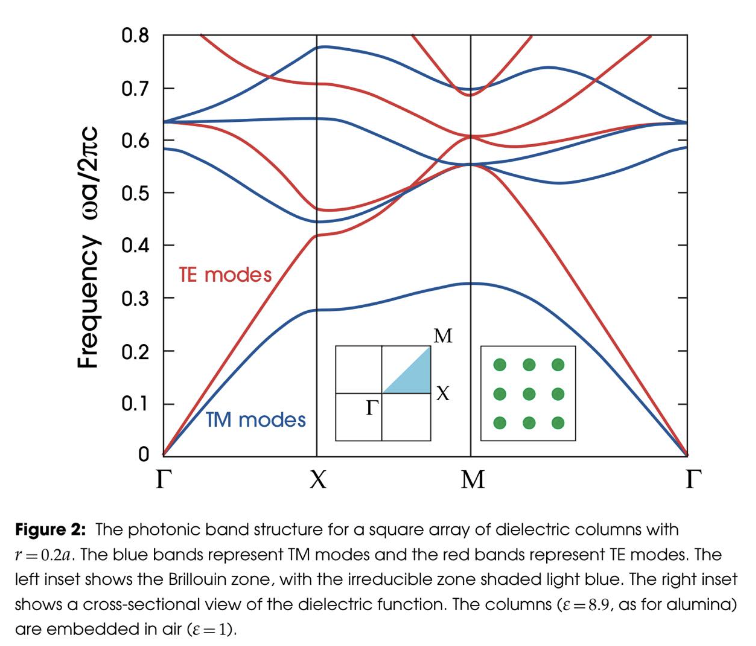
I have also confirmed that MPB is correct in this case by consulting the literature. For refference, there is a bandstructure of a PHC from [1] page 68Using MPB, I am able to replicate the recults perfectly, but using Lumerical, I obtain this:
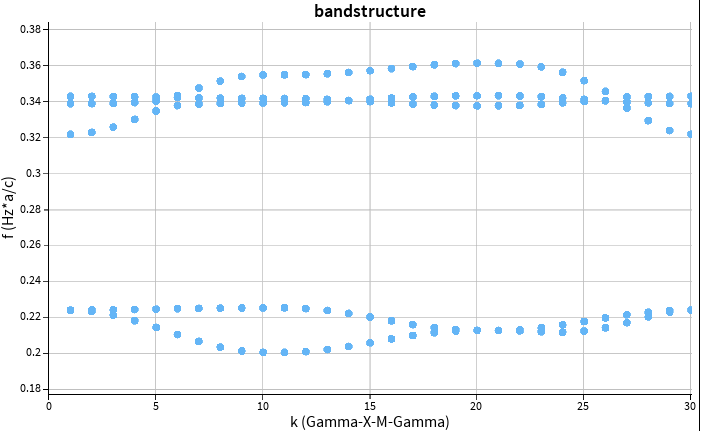
I have specifically targeted frequency range to go from 0.2 to 0.4 a/c.
I have used a=500 nm in my FDTD simulations.
Could you please help me reproduce the results from the [1] I have shown here? TM modes are sufficient.
[1] MEADE, Robert D. VE; JOHNSON, Steven G.; WINN, Joshua N. Photonic crystals: Molding the flow of light. 2008. -
April 3, 2024 at 4:02 pm
Guilin Sun
Ansys Employee"I have tried increasing the simulation time up to 10 times the original 10 000 fs, but the result remains unchanged. I am limiting the frequency to visualize only the first five bands, but in Lumerical, many more bends appear in that frequency range. "
Unfortunately, we do not know what the simulation time it will be in order to get the correct band structure. You may change simulation time and see if it improves.
MPB can easily simulate a specified polarization. However if the structure has no symmetry, FDTD will simulate all polarization. Please make sure the meaning of TM is the same, since it can be confused with TE as the definition is not unique. But from your result, it seems the TM is correct as it shows the bandgap.
Since you have obtained satisfactory result at lower refractive index, you can gradually increase the refractive index with proper simulation time to match the other.
-
- The topic ‘Bandstructure disagreement, FDTD vs MPB’ is closed to new replies.


-
4607
-
1515
-
1386
-
1209
-
1021

© 2025 Copyright ANSYS, Inc. All rights reserved.

