-
-
November 11, 2024 at 2:19 pm
Dimloc
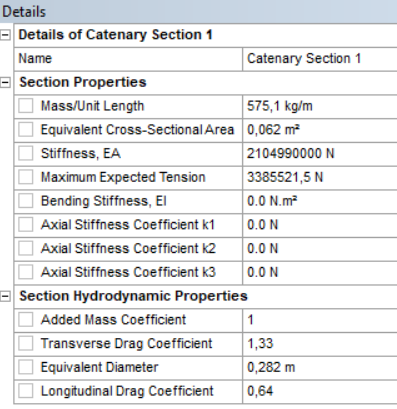
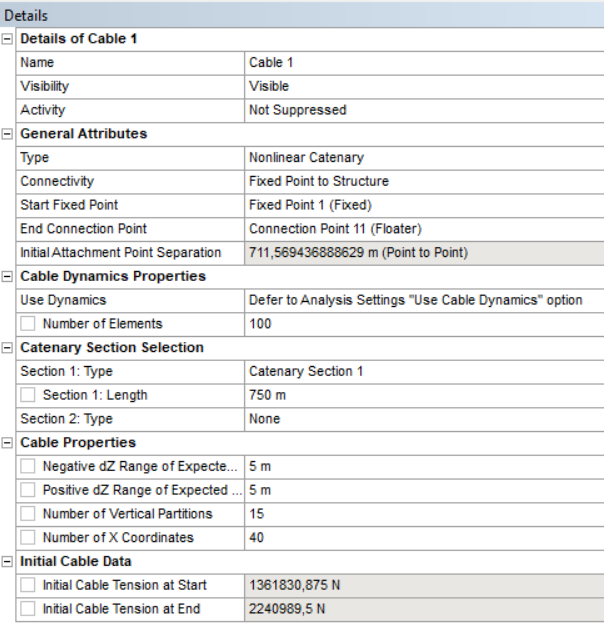
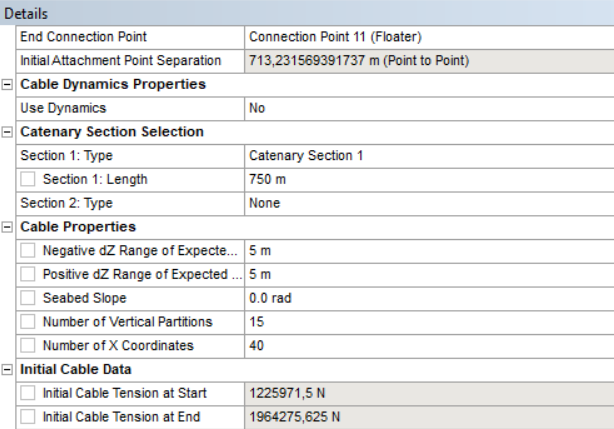
SubscriberA scaled-up Floating Wind Turbine (FWT) based on the OC4 design for a 10 MW wind turbine has been considered in this analysis. In this configuration, three pairs of chains have been utilized for the mooring lines. The characteristics of these lines are illustrated in Figure 1 (Catenary Section 1), while the properties of each cable are detailed in Figure 2 (Details of cable 1).
The assumed pretension for each line is Tp = 1950 kN. To incorporate this value (Tp) into the analysis, the coordinates of the fixed points on the seabed were evaluated. For Line 1, the coordinates are -738.193 m, -48.105 m, and -200 m. These values were derived using the equation: Line_length – Line_suspended + horizontal_projection_of_the_suspended_line + Distance_between_the_fairlead_from_the_start_point for a pretension value 1950 kN.
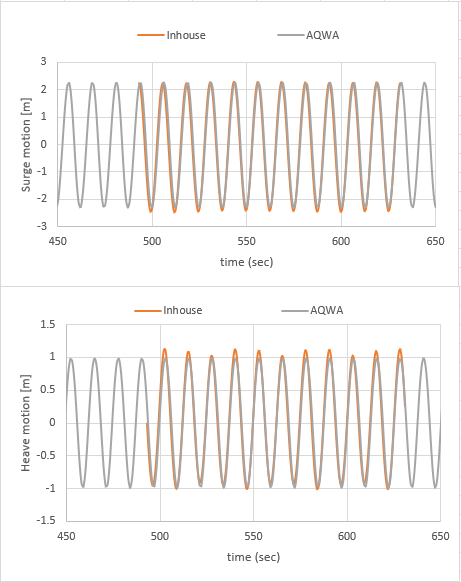
The study focuses on a case involving linear waves, with no wind or current, characterized by a wave height (H) of 8 m and an angular frequency (ω) of 0.5 rad/s. Comparisons between the AQWA software and in-house software show promising results regarding the moored structure's responses (refer to Figure 3).
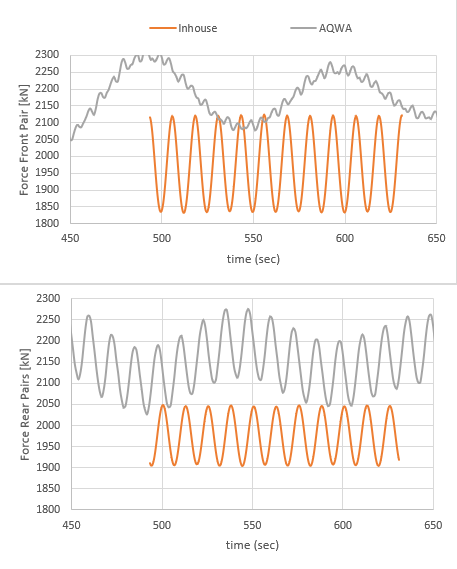
However, the tension forces at the fairlead connectio exhibit discrepancies. Specifically, the total cable forces for the rear pairs of lines oscillate around 2100 kN, whereas they should oscillate around the pretension value (refer to Figure 4). Additionally, the time history of the front pair of lines does not exhibit a similar oscillatory behavior as observed in the other lines (refer to Figure 5).
Any support is greatly appreciated. -
November 21, 2024 at 11:19 am
Dimloc
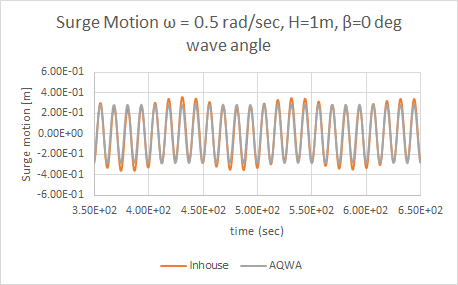
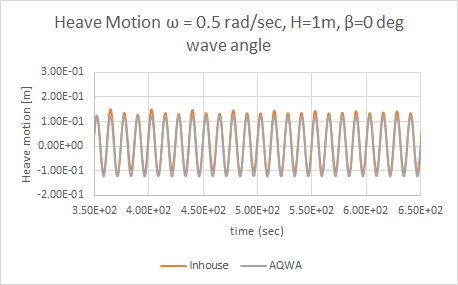
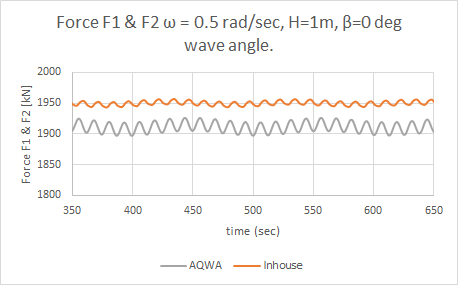
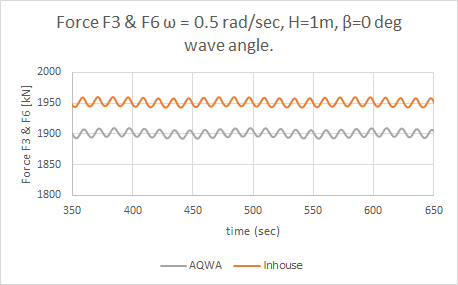
SubscriberFurthermore, the issue persists for a wave height of H = 1 meter (the mass/unit length has been recalculated to 493,1kg/m). Below, I provide a comparison between the in-house calculations and those obtained from AQWA. Notably, each line’s initial cable tension data, as computed by AQWA, are approximately 1220 kN at the start and 1960 kN at the end. It is important to note that the coordinates of the fixed bottom points were selected appropriately to achieve a pretension of 1950 kN. These values (1960 kN and 1950 kN) are quite similar. However, if I am not mistaken, the tension forces at the end should oscillate around the pretension value, rather than being observed at 1900 kN. It appears that I may be overlooking something in this analysis.
-
December 20, 2024 at 3:11 pm
-
- You must be logged in to reply to this topic.


-
4618
-
1535
-
1386
-
1210
-
1021

© 2025 Copyright ANSYS, Inc. All rights reserved.

