TAGGED: cfd-post, contour, fluent, shear-stress, xy-plot
-
-
June 4, 2023 at 3:45 pm
Panagiotis Artemiou
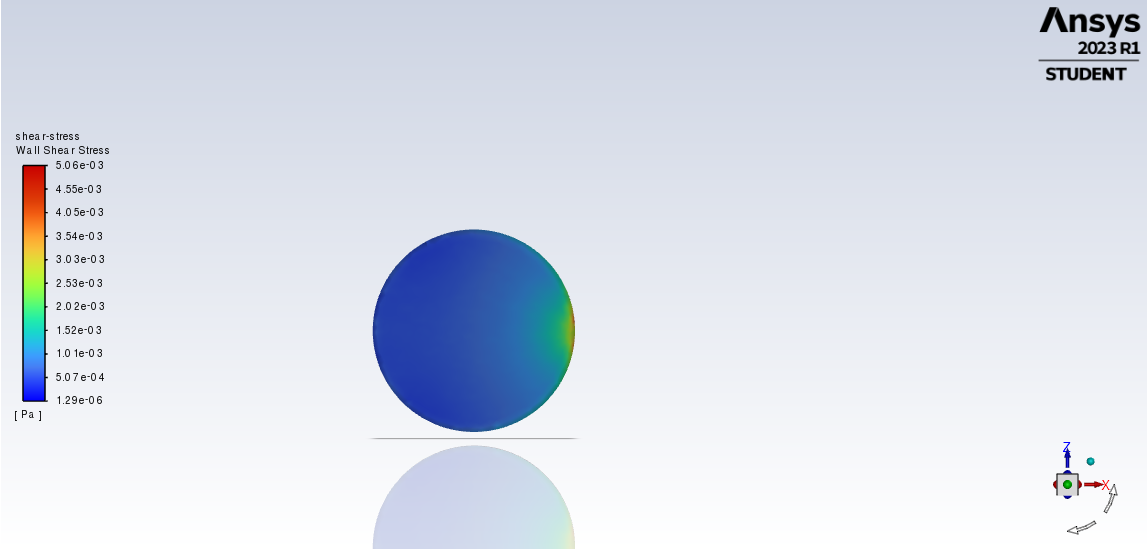
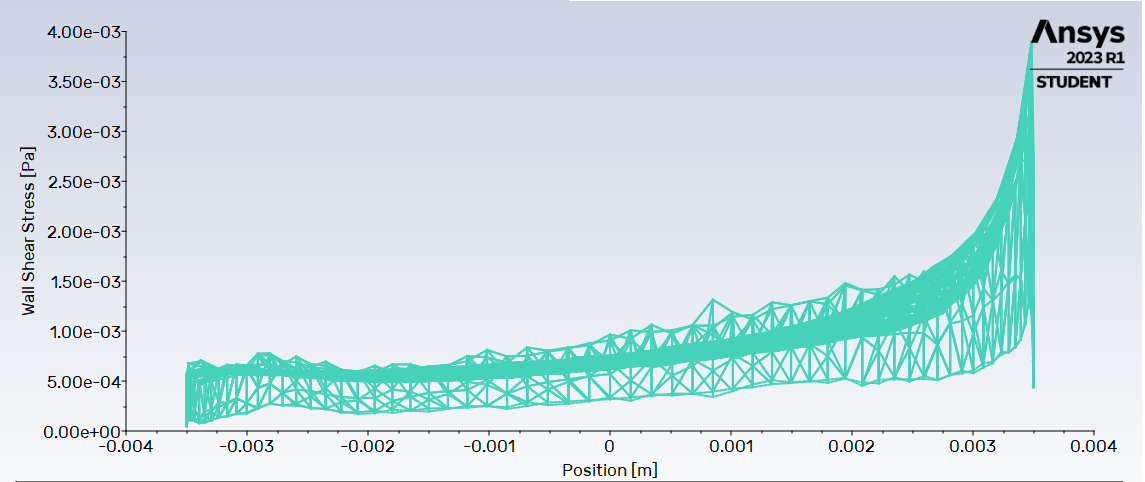
SubscriberI have a 3D simulation and i have a contour that is shown in the first attached picture. This depicts the shear stresses on a 3D geometry. I want to make a xy-plot that plots the shear stresses along the x axis and I get the result that can be seen in the second attached picture. I guess that, because the geometry is 3D it takes all the values of y and z for a specific x, and plots along x. I want to plot along x but only keep the maximum value of the other so that the xy-plot is just a single curve that plots the maximum values for each x. How can i do that?

-
June 5, 2023 at 5:33 am
Nikhil N
SubscriberHello,
I suggest creating a line or rake and using it to plot data. If you want to plot a variable that varies along any surface, there are two options. In CFD-post, you can create a polyline. Alternatively, in Fluent, you can create an iso-surface in the form of a line, although it may require some workaround to achieve this.
-
June 5, 2023 at 5:36 am
Nikhil N
SubscriberIf you prefer to focus on plotting the maximum value within the status quo, you can export the X-Y plot to a file and then manipulate the data using various external data management and visualization tools available.
-
- The topic ‘ANSYS Fluent (post): how to plot maximun values of a field in xy-plot along axis’ is closed to new replies.


-
5159
-
1836
-
1387
-
1249
-
1021

© 2026 Copyright ANSYS, Inc. All rights reserved.


