
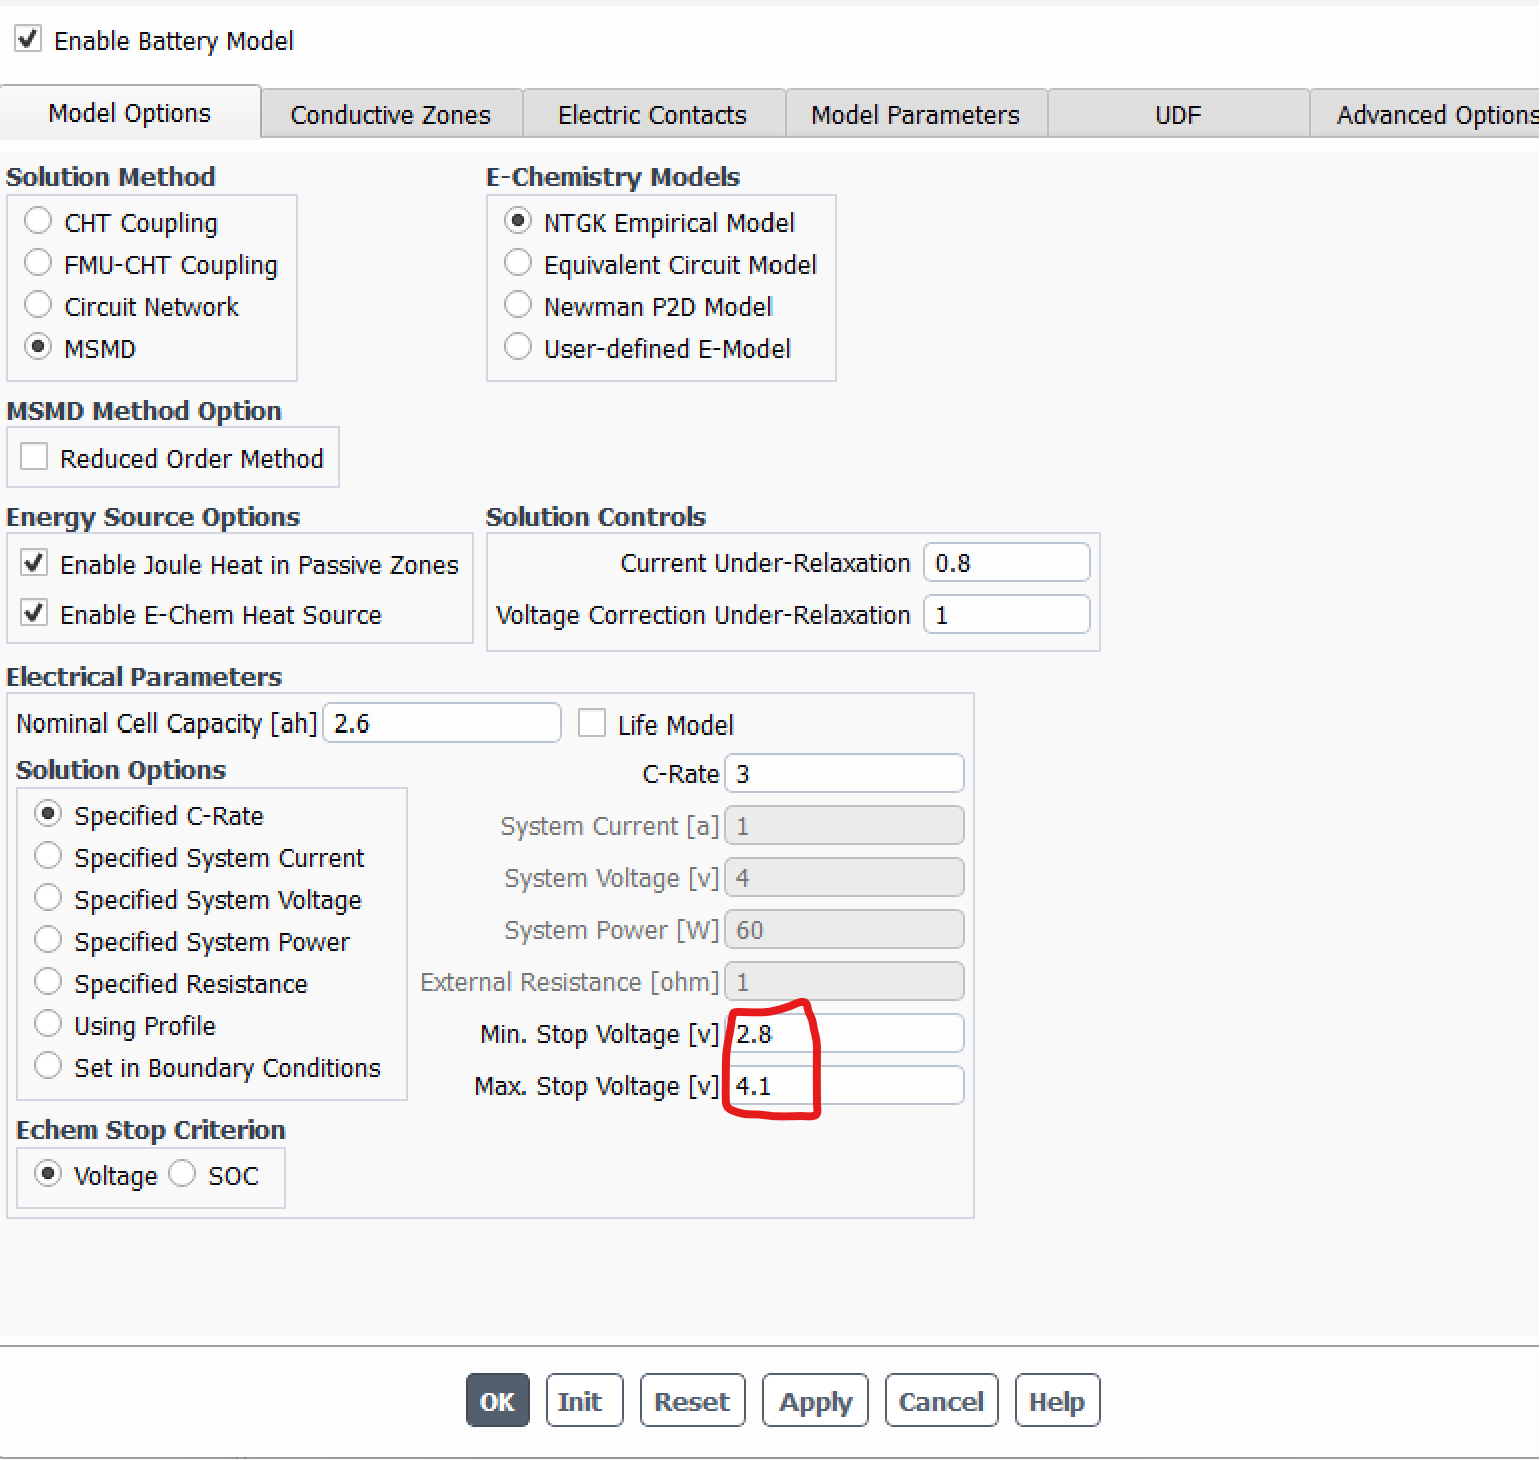
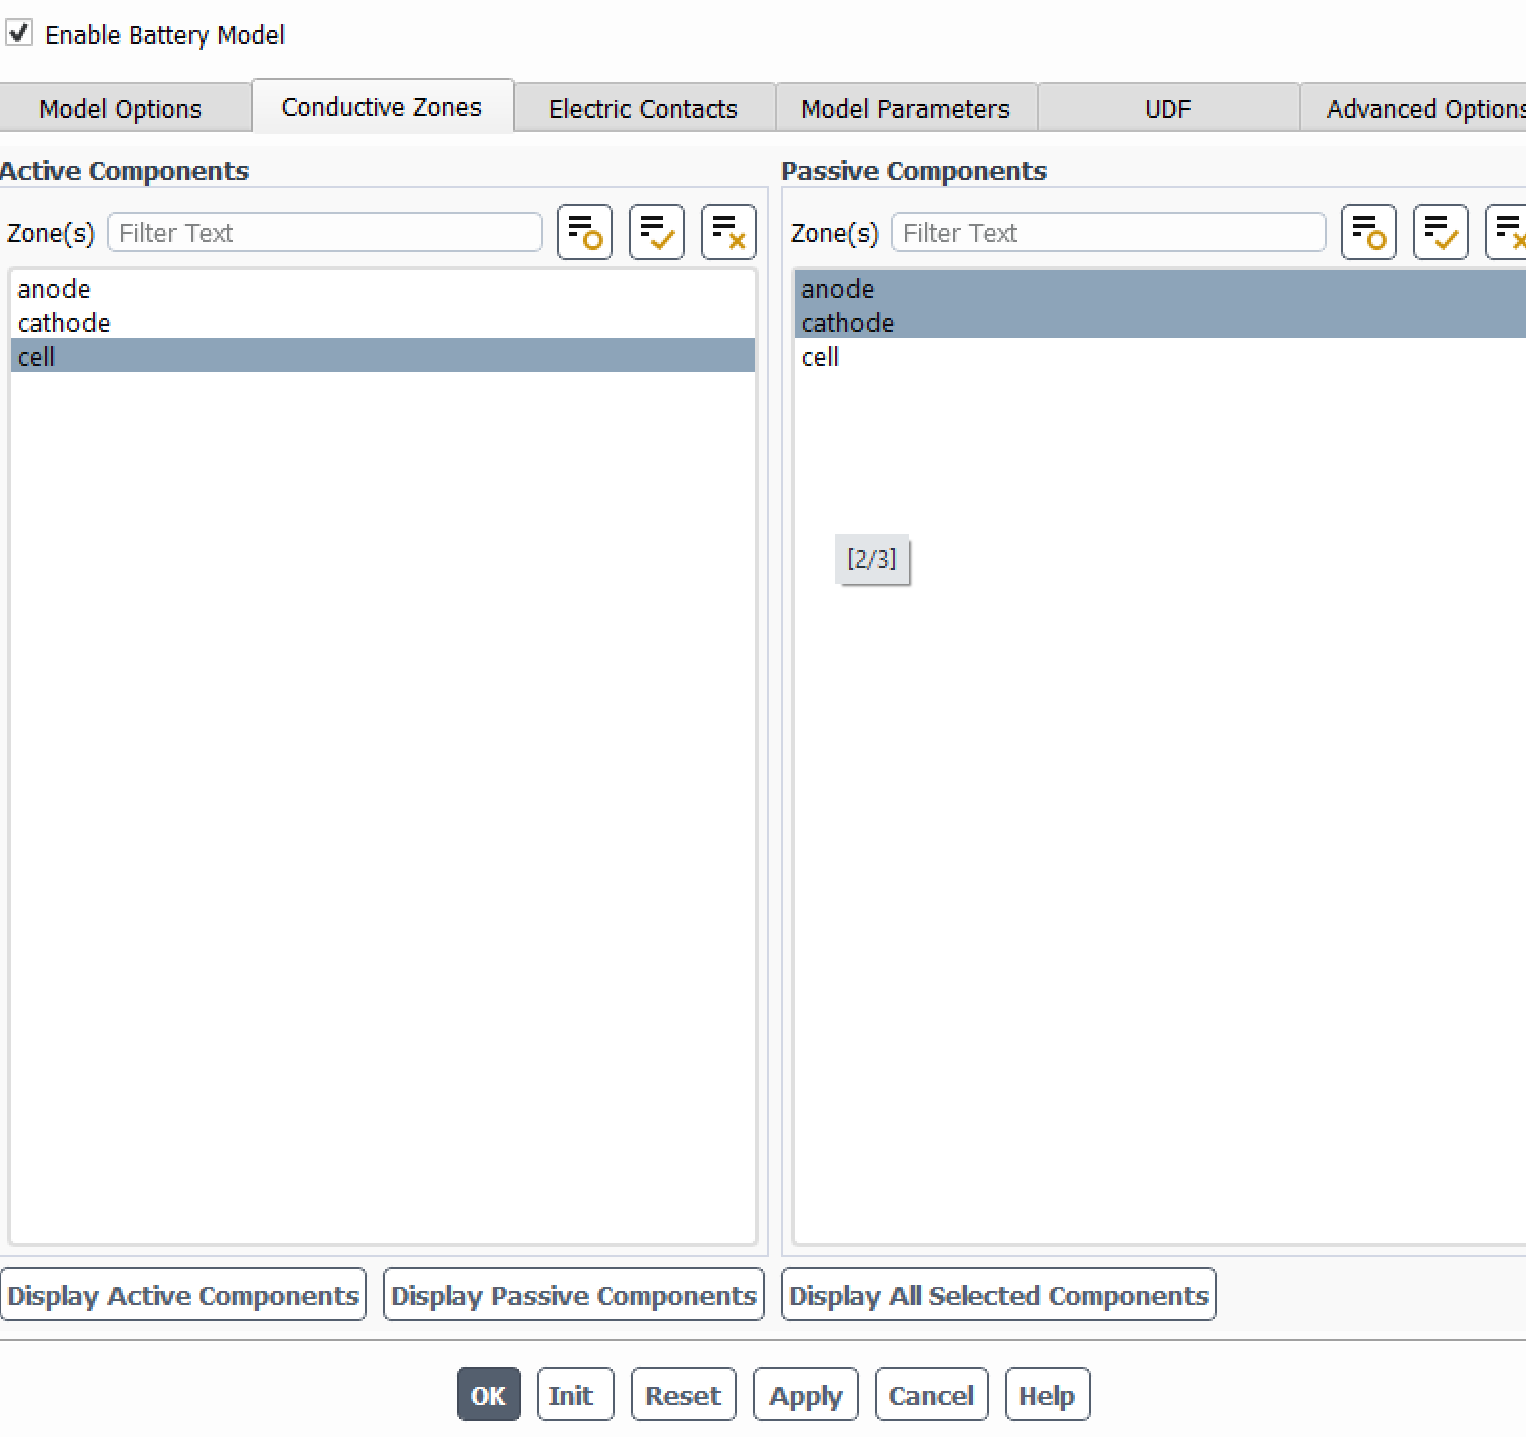
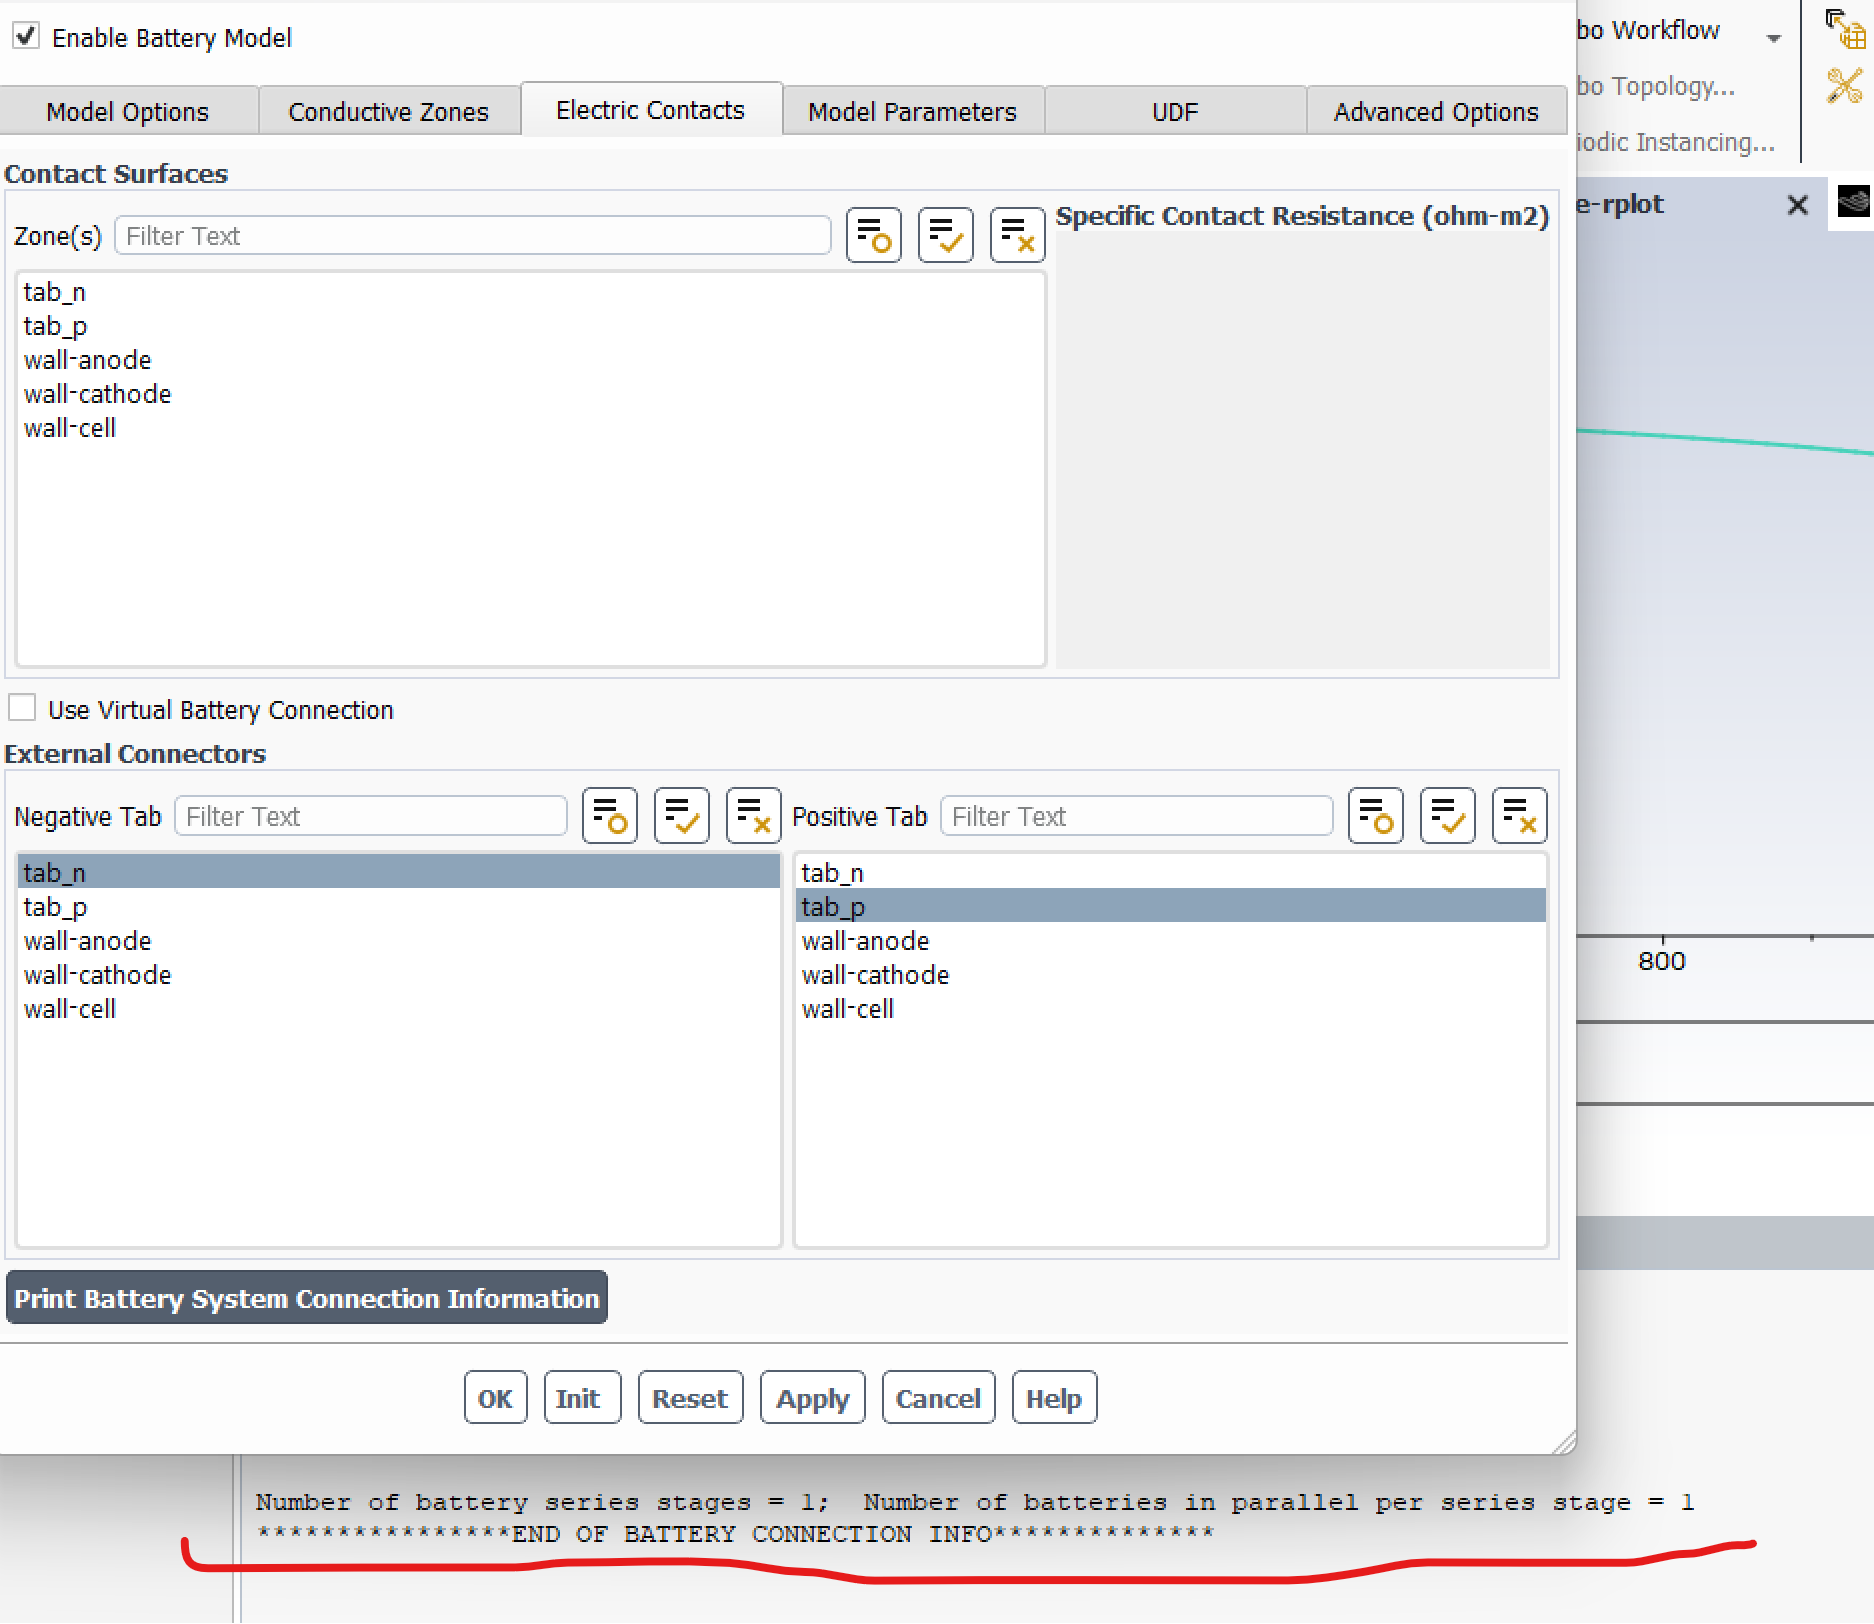
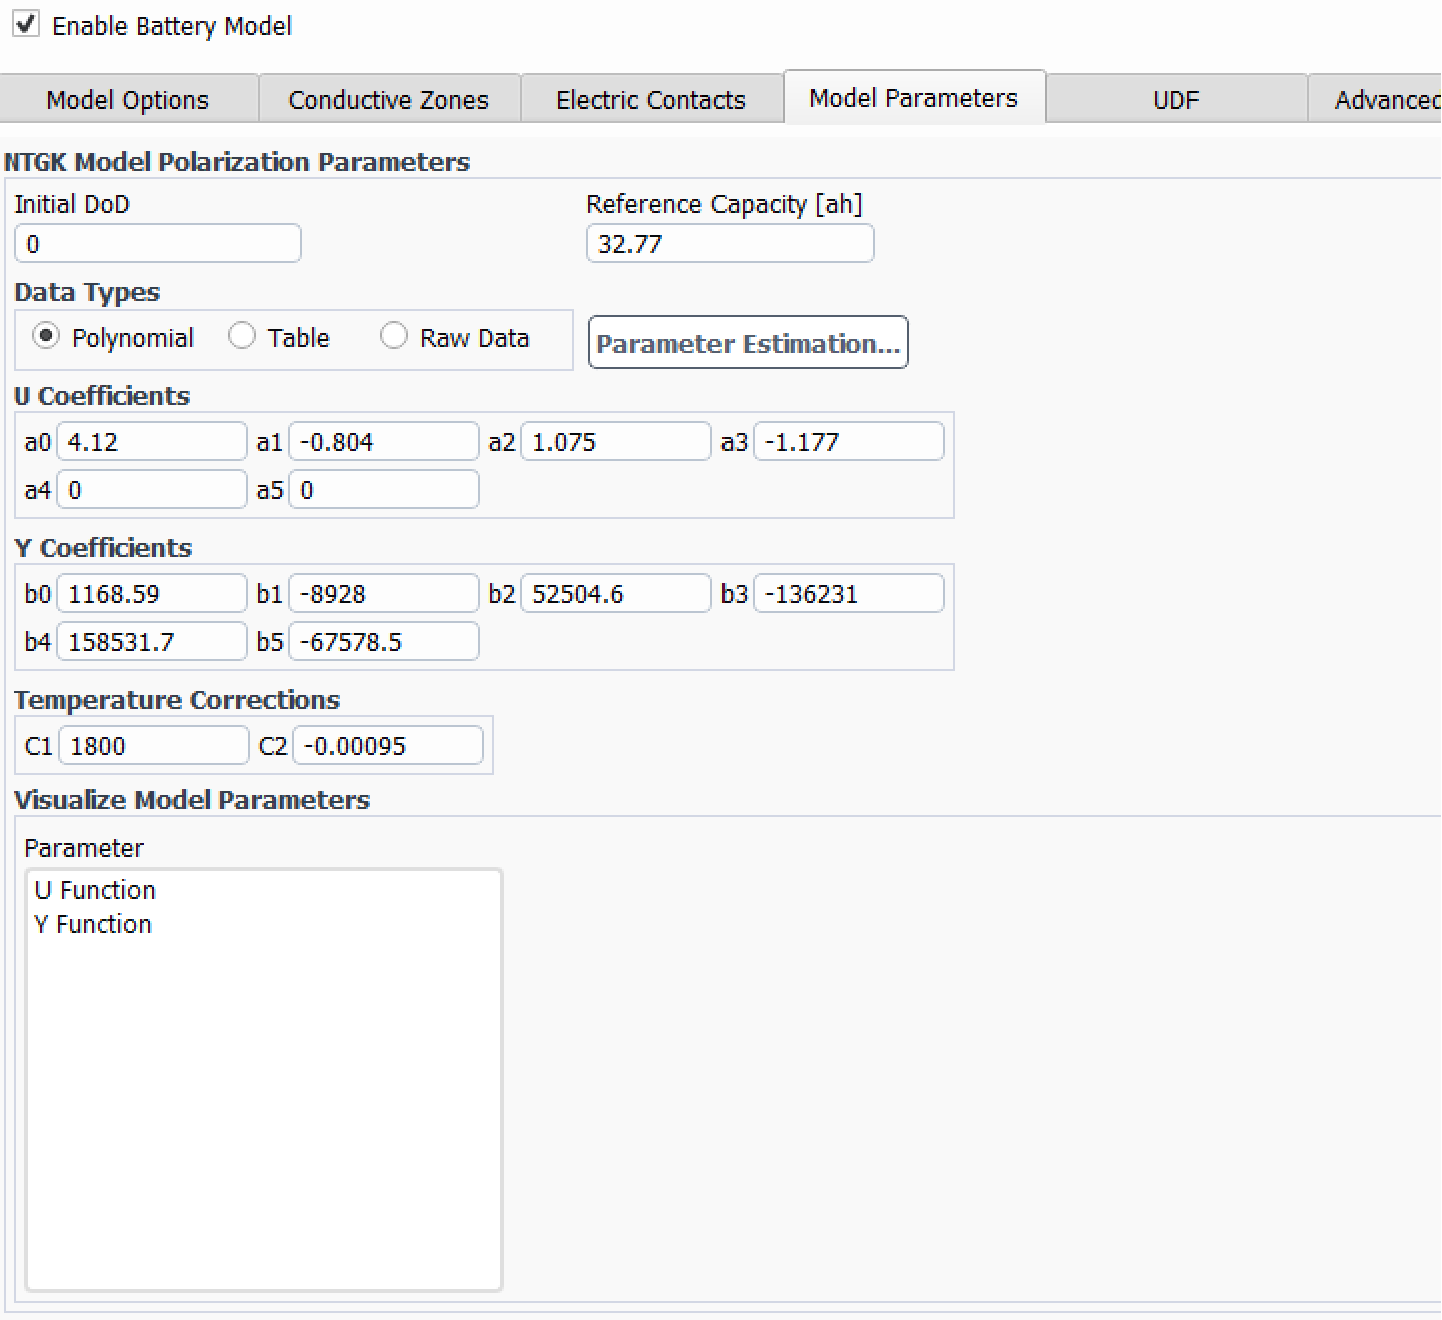
About Voltage curve in my battery simulation


Viewing 8 reply threads
- The topic ‘About Voltage curve in my battery simulation’ is closed to new replies.


