Ansys Learning Forum › Forums › Discuss Simulation › Photonics › Transmission spectra at different temperatures › Reply To: Transmission spectra at different temperatures
January 3, 2025 at 6:36 pm
Forum Moderator
Dear Subscriber,
First, try changing the temperature manually, as described in the post Simulation at different temperatures, and verify if you can generate a single graph. Once confirmed, you can utilize the Parameter sweep utility to vary the temperature and obtain multiple results in a single run.
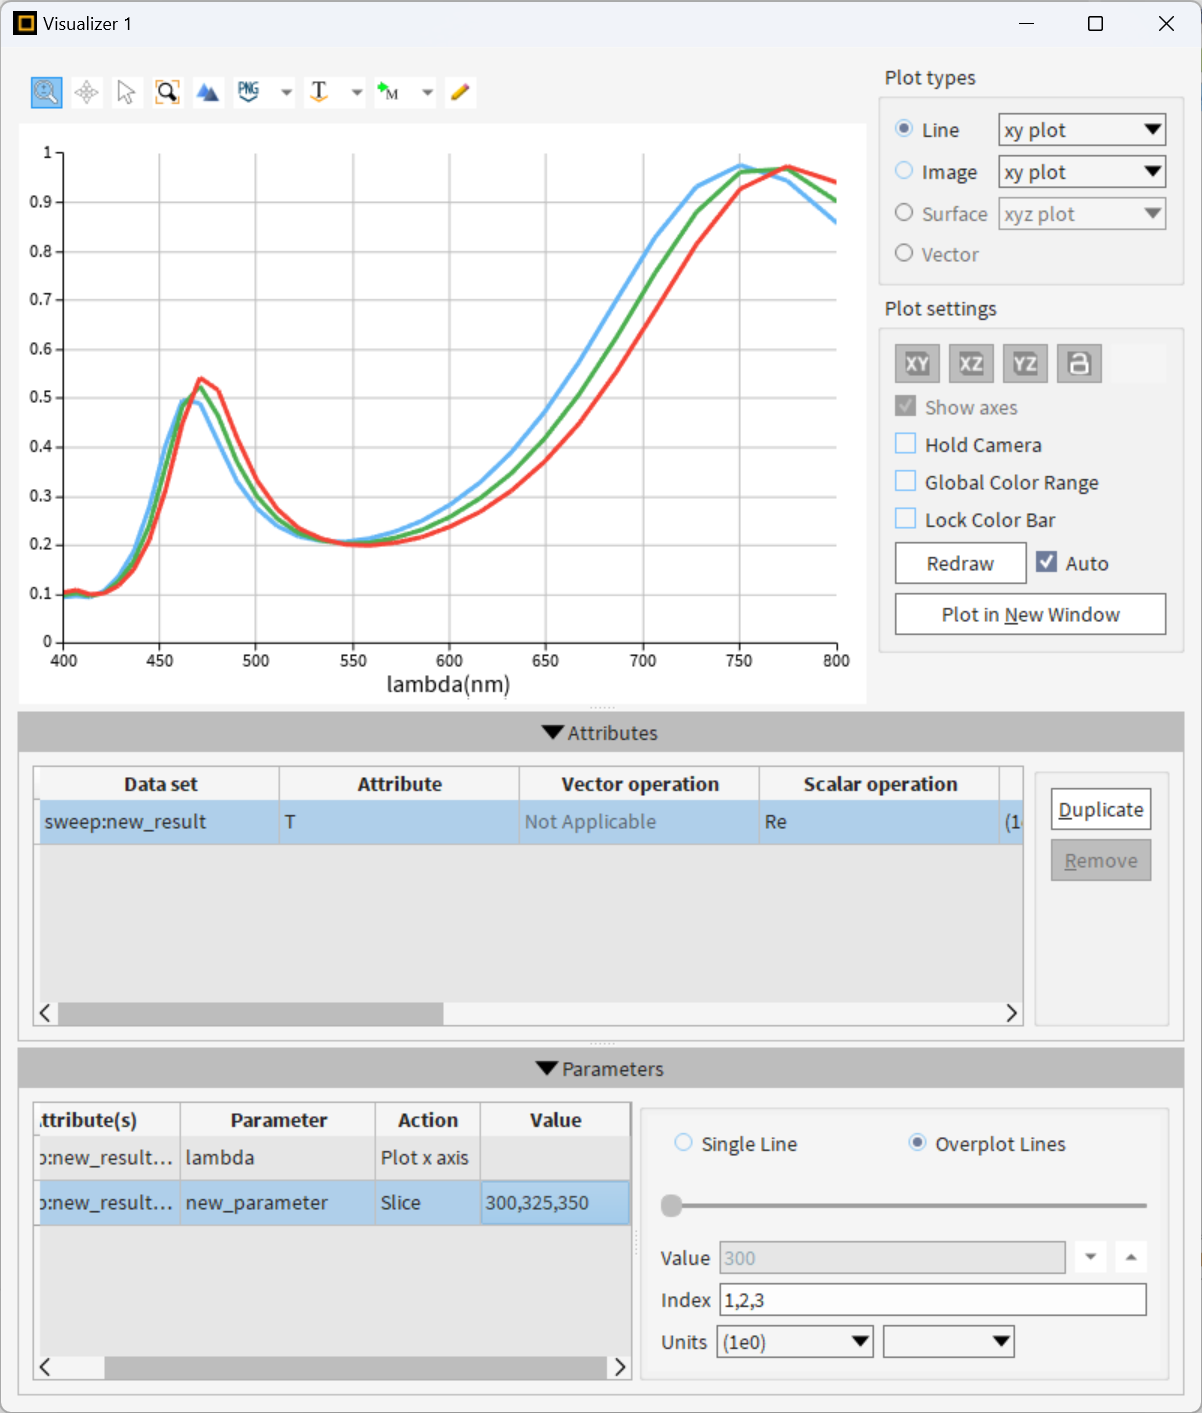
Then it is possible to visualize the sweep results as ‘overplot lines’ as follows:
Best regards,
Kirill


